Consortium for Ocean Leadership
Nannofossils Reveal Seafloor Spreading Truth
Spread the word about seafloor spreading! Junior geologists prove Albert Wegener right in an activity that combines data analysis and deep ocean exploration. Learners analyze and graph fossil sample data taken from sites along the...
NASA
The Big Climate Change Experiment Lesson 3: Climate Change Lines of Evidence
Consider the preponderance of evidence when making a verdict. The third of five lessons in Unit 1: The Big Climate Change Experiment focuses on the evidence for climate change. Learners study graphs, diagrams, and pictures regarding...
University of Colorado
Solving a Mixed Up Problem
Begin the process of adding and subtracting spectra. Having a basic understanding of occultation events, pupils begin the pursuit to determine what a found atmosphere might contain. Learners work with two graphs and calculate what the...
Curated OER
Regents High School Examination: Living Environment 2009
Emerging ecologists need a full understanding of life, from the inner workings of a cell to the complex relationships among organisms. This examination is meant to assess high schoolers after an entire year course on the living...
Curated OER
Physical Setting: Physics Exam 2004
Twelve pages of mostly multiple-choice questions comprise this comprehensive New York Regents physics exam. It covers an entire year's worth of physics curriculum and requires about three hours for completion. Review the questions to...
Space Awareness
The Climate in Numbers and Graphs
Weather versus climate: weather relates to short time periods while climate averages the weather of a period of many years. Scholars learn about average temperature and precipitation in various climate zones and then apply statistics...
BW Walch
Creating and Graphing Exponential Equations
Frequently found in biology and economic application problems, exponential equations show up as stars in this introductory presentation. Taking no background or knowledge of exponentials for granted, the slides walk learners through the...
Shodor Education Foundation
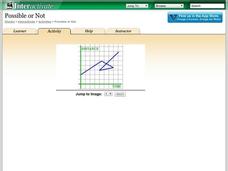
Possible or Not?
What does the graph mean? Pupils view 10 graphs and determine whether they are possible based on their contexts. The contexts are distance versus time and profit versus time.
New York City Department of Education
Grade 5 Literacy in Science: Ecosytems
How do humans affect ecosystems? Learners read two articles and interpret a graph to develop essays on the human impact on ecosystems. They read about human impact on tigers and manatees as a basis for their overarching papers.
Curated OER
Ornithology and Real World Science
Double click that mouse because you just found an amazing lesson! This cross-curricular Ornithology lesson incorporates literature, writing, reading informational text, data collection, scientific inquiry, Internet research, art, and...
Mascil Project
Epidemics: Modelling with Mathematics
The Black Death epidemic is responsible for more than one million deaths in the United Kingdom. An inquiry-based activity has young scholars explore the rate of disease spread. They then analyze graphs showing data from epidemics such as...
Alabama Learning Exchange
I Know What You Did Last Summer: A Data Graphing Project
Young scholars participate in graphing data. In this graphing data instructional activity, students make a stem and leaf plot of their summer activities. Young scholars create numerous graphs on poster boards. Students discuss the...
Curated OER
Bycatch
Bycatch is the unwanted and discarded marine life caught during commercial fishing. Young marine scientists review bycatch litigation and analyze graphs of bycatch data and answer questions about it. This raises awareness while...
InqueryPhysics
Interpreting Motion Graphs
Every movement in the world can be measured and even motionless objects can be significant indicators of movement. Focus on motion graphs that feature distance vs. time, speed vs. time, and positive and negative acceleration.
California Academy of Science
California's Climate
The United States is a large country with many different climates. Graph and analyze temperature and rainfall data for Sacramento and Washington DC as you teach your class about the characteristics of Mediterranean climates. Discuss the...
Mascil Project
House Insulation
Make sure your house is warm in the winter. Pupils analyze graphs of heating costs for two similar houses and make hypotheses for why the costs differ. They then build models of houses with appropriate insulation to reduce heating costs.
Curated OER
Glenbrook South High School Science Scoring Rubric: Student Laboratory Reports
Here is an unexpected, but practical resource. It is not a instructional activity, but rather an outline of what a science laboratory participant should include in a report. Especially valuable is a grading rubric that spells out what is...
Curated OER
Regents High School Examination: Physical Setting Earth Science 2009
Junior geologists address 50 multiple choice questions and 35 short answer questions about the earth system. Plenty of visuals are included for interpretation: diagrams, graphs, maps, photographs, laboratory setups, weather symbols, and...
Curated OER
What's in the Water? - Stream Side Science
Here is a complete activity in which young biologists or ecologists test the pH, dissolved oxygen, turbidity and temperature of stream water. The class visits an actual stream and makes observations of the site. They use scientific...
Curated OER
Temperature and the Earth's Atmosphere
Earth science super stars visit the National Earth Science Teachers Association's interactive website to glean information on the layers of the atmosphere. Data tables are provided for them to record what is collected. This assignment...
NASA
Discovering the Milky Way
What do you call a tiny collection of galaxies? A puny-verse! Young scholars graph data gathered by scientists studying Cepheids. They attempt to identify a relationship between the variables through standard and logarithmical graphing....
Polar Trec
Global Snow Cover Changes
Snow is actually translucent, reflecting light off its surface which creates its white appearance. Pairs or individuals access the given website and answer questions about snow cover. They analyze graphs and charts, examine data, and...
Curated OER
Graphing Your Motion with Vernier LabQuests
Seventh graders create motion graphs using a motion sensor. In this physics lesson, 7th graders match the graph shown by moving their body. They relate the slope to the way they moved.
Curated OER
Data Collection
Students write a journal exercise that relates to pets. They collect information from each other in order to practice making and interpreting bar graphs. They Continue building different kinds of graphs with the group.


