Virginia Department of Education
Organizing Topic: Data Analysis
Learners engage in six activities to lead them through the process of conducting a thorough analysis of data. Pupils work with calculating standard deviations and z-scores, finding the area under a normal curve, and sampling techniques....
Statistics Education Web
Using Dice to Introduce Sampling Distributions
Investigate the meaning of a sample proportion using this hands-on activity. Scholars collect data and realize that the larger the sample size the more closely the data resembles a normal distribution. They compare the sample proportion...
Curated OER
Are Taxes "Normal?"
Students explore the concept of normal distribution. In this normal distribution lesson, students find the normal distribution of taxes in the 50 US states. Students make histograms, frequency tables, and find the mean and median of tax...
Mathematics Vision Project
Module 8: Statistics
What does it mean to be normal in the world of statistics? Pupils first explore the meaning of a normal distribution in the eight-lesson module. They then apply the statistics related to normal distributions such as mean, standard...
Mathematics Vision Project
Module 9: Statistics
All disciplines use data! A seven-lesson unit teaches learners the basics of analyzing all types of data. The unit begins with a study of the shape of data displays and the analysis of a normal distribution. Later lessons discuss the...
College Board
Is That an Assumption or a Condition?
Don't assume your pupils understand assumptions. A teacher resource provides valuable information on inferences, assumptions, and conditions, and how scholars tend to overlook these aspects. It focuses on regression analysis, statistical...
College Board
2013 AP® Statistics Free-Response Questions
AP® exams don't need to be shrouded in mystery. The 2013 AP® Statistics free-response questions are available for instructors to reference. It includes questions on mean, standard deviation, normal distribution, confidence intervals,...
Radford University
Big Future - How SAT Scores Play a Role in College Acceptance
Understanding the importance of SAT scores is as easy as ABC. A set of three statistics lessons teaches scholars about normal distributions, the Empirical Rule, and z-scores. They apply their newfound knowledge to investigate data...
Curated OER
Application and Modeling of Standard Deviation
The first activity in this resource has learners computing the mean and standard deviation of two different data sets and drawing conclusions based on their results. The second activity has them using a dice-rolling simulation to...
Curated OER
The Bell Curve
Students are introduced to the normal distribution and examine the bell curve controversy.
Curated OER
The Bell Curve
Students explore the concept of the bell curve. In this bell curve lesson, students discuss the controversy associated with the bell curve. Students use an applet to explore a normal distribution. Students discuss mean, median, mode,...
Curated OER
Determine the 90% Values Given the 50% Values
In this normal distribution worksheet, students determine the values for the middle 90% given the middle 50% values. Means and standard deviations are provided.
Statistics Education Web
Who Sends the Most Text Messages?
The way you use statistics can tell different stories about the same set of data. Here, learners use sets of data to determine which person sends the most text messages. They use random sampling to collect their data and calculate a...
College Board
Three Calculator Simulation Activities
Calculators sure come in handy. An AP® Statistics instructional resource provides suggestions for using calculator simulations. It gives activities for adding variances, normal probability plots, and t distributions.
Stats Monkey
Everything I Ever Needed to Learn about AP Statistics I Learned from a Bag of M and M's®
Candy is always a good motivator! Use this collection of M&M's® experiments to introduce statistics topics, including mean, standard deviation, nonlinear transformation, and many more. The use of a hands-on model with these AP...
Shodor Education Foundation
Overlapping Gaussians
Adjust the overlap to compare probabilities. Using sliders, learners adjust the shape of two Gaussian curves. The interactive calculates the area of the left tail for one curve and the right tail for the other. Pupils set the interactive...
Curated OER
Probability and Standard Deviation
In this probability and standard deviation worksheet, students answer 5 questions derived from one scenario that involving finding percentages.
Rice University
Introductory Statistics
Statistically speaking, the content covers several grades. Featuring all of the statistics typically covered in a college-level Statistics course, the expansive content spans from sixth grade on up to high school. Material comes from a...
College Board
2005 AP® Statistics Free-Response Questions Form B
Here's another great way to learn from the past. Released free-response questions provide a look into how concepts measured on the 2005 AP® Statistics Exam on Form B. Teachers and pupils review questions that cover concepts such as...
College Board
1999 AP® Statistics Free-Response Questions
Closer to 2010 than expected. Several of the 1999 AP® Statistics free-response questions align to Common Core standards. Items ask pupils to analyze residuals, two-way tables, and calculate expected values to determine the fairness of a...
Illustrative Mathematics
Should We Send Out a Certificate?
Fred thinks his test score is high enough to earn him a certificate. Given the mean and standard deviation, use properties of normal distributions to calculate Fred's percentile ranking and see if he is right. Consider having your class...
Curated OER
Confidence Intervals: Population Mean; Population Standard Deviation Unknown
In this confidence interval worksheet, young scholars examine given statistical information to find the margin of error. They construct a confidence interval for the population and find the mean. Seven statistical problems are available...
Curated OER
Central Tendencies and Normal Distribution Curve
Fourth graders are given data (class test scores) to determine central tendencies, and find information needed to construct a normal distribution curve. They become proficient in calculating mode, median and average.
Curated OER
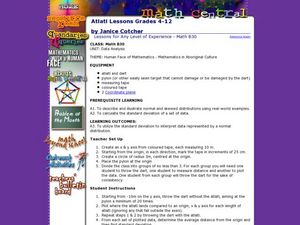
Human Face of Mathematics - Mathematics in Aboriginal Culture
Students collect statistical data. In groups, students play a dart game and then determine the distance between darts. They collect the data and plot the information on a coordinate plane. They identify the mean and the standard...


