Chicago Botanic Garden
Plant Phenology Data Analysis
Studying data over time can paint a pretty interesting picture. Learners use data they collected in the previous instructional activity to compare to historical data in a similar region. They graph the data of the first bloom of a...
Curated OER
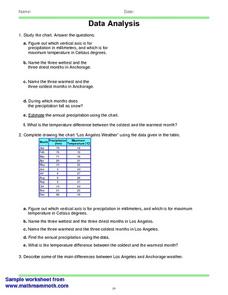
Weather Data Analysis
In this weather learning exercise, students read a data table comparing the temperature and weather conditions at three different locations. Students use this data to complete 8 fill in the blank, 1 short answer question, and one graph.
NOAA
Climate, Weather…What’s the Difference?: Make an Electronic Temperature Sensor
What's the best way to record temperature over a long period of time? Scholars learn about collection of weather and temperature data by building thermistors in the fourth installment of the 10-part Discover Your Changing World series....
Curated OER
Reading Graphs
Encourage kids to read line graphs with confidence using these examples and accompanying comprehension questions. Learners examine two graphs and answer four questions about each. This is definitely intended for beginners to this type of...
Curated OER
Weathering Lab
Assist your middle school class with one of the most inclusive weathering and erosion labs available. Individuals use sugar cubes and alka-seltzer to demonstrate the process of physical and chemical weathering. They sketch results...
Laboratory for Atmospheric and Space Physics
Science at 100,000 Feet
Take your class up, up, and away with an engaging weather balloon simulation! Individuals get hands-on experience in creating and launching their own airborne labs to study how temperature and pressure affect substances at 100,000...
Radford University
A Change in the Weather
Explore the power of mathematics through this two-week statistics unit. Pupils learn about several climate-related issues and complete surveys that communicate their perceptions. They graph both univariate and bivariate data and use...
Living Rainforest
Finding the Rainforests
From Brazil to Indonesia, young scientists investigate the geography and climate of the world's tropical rain forests with this collection of worksheets.
NOAA
Understanding El Niño Using Data in the Classroom
Are weather troubles caused by El Nino? An installment of a larger series presents a five-part lesson on El Nino. First, scholars learn to read sea surface temperature maps. Then, they compare them to data on graphs before determining if...
Curated OER
Data Analysis 2
In this data analysis learning exercise, students read and interpret given line graphs. They determine the range and average. This one-page learning exercise contains five problems.
Chicago Botanic Garden
Historical Climate Cycles
Scientists use ice core samples to obtain temperatures of the earth from 400,000 years ago! The third of five lessons instructs pupils to interpret historical climate data to see changes over time. In part I, participants interpret...
Curated OER
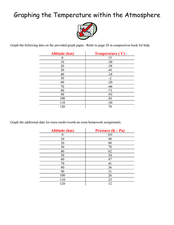
Graphing the Temperature within the Atmosphere
Musing meteorologists design graphs of the temperature and pressure changes for altitude increase in our atmosphere. The activity is pertinent to middle school earth science curriculum. Vary the type of homework you assign when teaching...
Curated OER
Cricket Weather
In this collecting data worksheet, 4th graders use the data collected on crickets chirps and the temperature to make a line graph by following 4 directives.
Curated OER
Which Kind of Weather Do You Like Best? -- Class Bar Graph
In this math worksheet, students generate a class bar graph. Classmates are surveyed about favorite weather: sunny, rainy, snowy, cloudy or windy. Results are displayed on a bar graph.
Curated OER
Interpreting Graphs: Temperate Climates
In this interpreting graphs activity, students read a graph containing data of rainfall and temperature, then complete 18 questions, interpreting the data.
Howard Hughes Medical Institute
Paleoclimate: A History of Change
Earth's climate changed drastically throughout the history of the planet, so why do scientists blame humans for recent changes? Observe data covering the history of the planet that proves the natural climate change patterns. Then, learn...
Curated OER
Air Pollution:What's the Solution?-Weather's Role
In this air pollution and weather worksheet, students collect data using an online animation to determine the air quality at given times along with the wind speed and temperature in a particular city. Students make 3 bar graphs using the...
Chicago Botanic Garden
Unit 2 Pre-test, Grades 7– 9
This pre-assessment launches a unit on climate change and weather. 15 questions, both short answer and multiple choice, asses the classes' knowledge about these concepts.
Curated OER
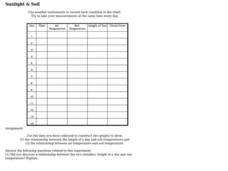
Sunlight & Soil
In this earth science worksheet on sunlight and soil, students use data collected in a chart to construct two graphs. Following, they answer five questions as they relate to the experiment performed.
Curated OER
Line Graphs 4
In this graph activity, students interpret given line graphs. They determine the range, and identify the range in a set of data. This one-page activity contains approximately 14 problems.
Curated OER
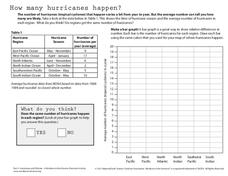
How Many Hurricanes Happen?
In this hurricanes worksheet, learners use a data table showing the hurricane region and the average number of hurricanes per year to determine if the same number of hurricanes happen in each region by creating a graph. Then students...
Curated OER
Weather Conditions
In this weather conditions worksheet, students use a month of recorded weather conditions to create a graph comparing the number of days it was cloudy, raining, or clear. This worksheet has a graphic organizer and a graph.
Curated OER
Seasonal Graphs
In this math worksheet, learners create a graph using the data recorded from the local newspaper concerning local temperatures.
Curated OER
Make a Bar Graph
In this bar graphs learning exercise, students use the tally chart to make a bar graph. Students color one box for each tally mark and then use the chart to help answer the questions about the sunny, cloudy, and rainy days.


