National Humanities Center
Teaching The Great Gatsby: A Common Core Close Reading Seminar
The 41 slides in a professional development seminar model how to use close reading techniques to examine the many layers of F. Scott Fitzgerald's The Great Gatsby. In addition to passages from the novel, slides provide biographical...
EngageNY
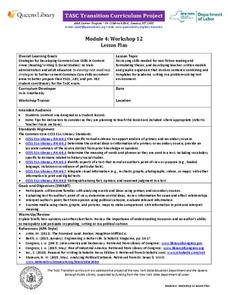
TASC Transition Curriculum: Workshop 12
How can opinions slant facts? Workshop participants learn how to examine primary and secondary sources and identify the author's point of view. They also examine how visual art impacts the meaning and rhetoric of sources. Full of...
Better Lesson
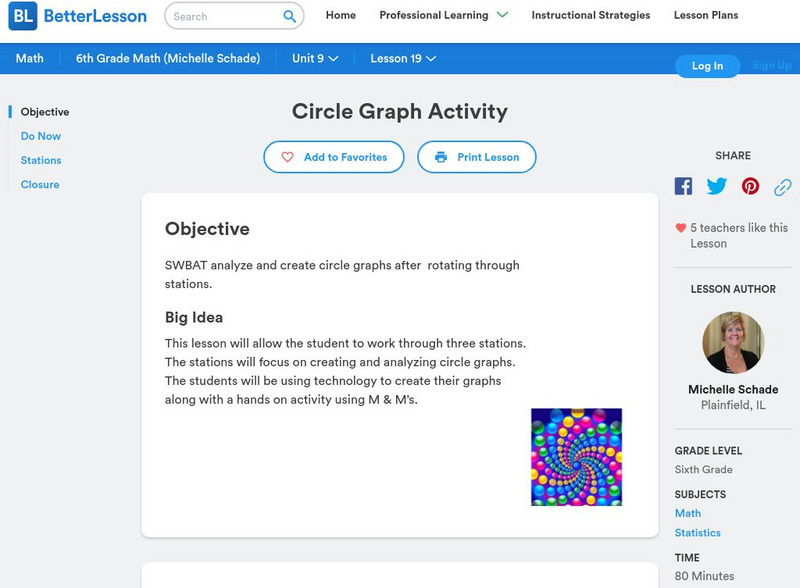
Better Lesson: Circle Graph Activity
This lesson will allow the student to work through three stations. The stations will focus on creating and analyzing circle graphs. The students will be using technology to create their graphs along with a hands-on activity using M&M's.
Khan Academy
Khan Academy: What Are Acceleration vs. Time Graphs?
What can you learn from graphs that relate acceleration and time? This tutorial takes a look at the vertical axis, slope, and area on a graph and provides examples.
Texas Education Agency
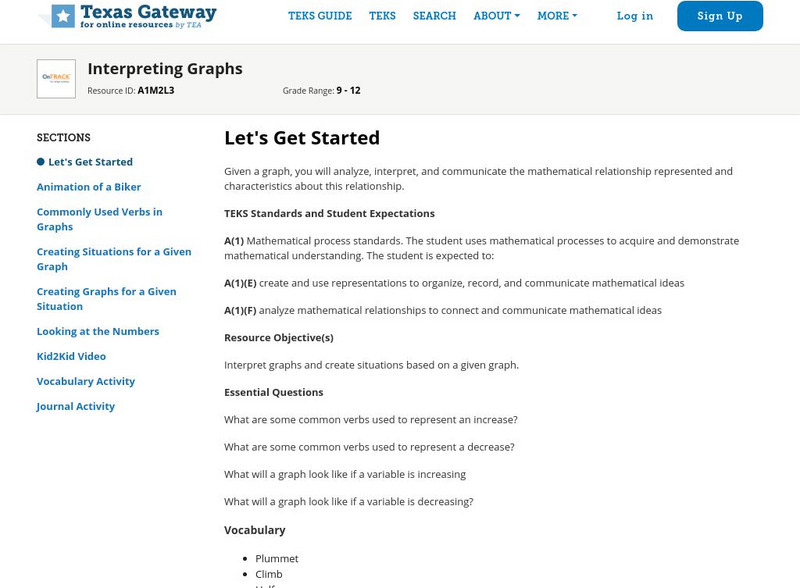
Texas Gateway: Interpreting Graphs
Given a graph, the student will analyze, interpret, and communicate the mathematical relationship represented and its characteristics.
Khan Academy
Khan Academy: What Are Position vs. Time Graphs?
What can you learn from graphs that relate position and time and how are they useful? Article relates what the verticle axis, slope, and curvature represents on a position graph and provides examples.
Texas Education Agency
Texas Gateway: Graphing Data to Demonstrate Relationships
Given problem situations, the student will graph data with a constant rate of change to demonstrate relationships in familiar concepts, such as scaling.
Concord Consortium
Concord Consortium: Smartgraphs: Equivalent Graphs
Students investigate graphs that are equivalent, in the sense that they represent the same data, though they look different because they employ different scales.
Concord Consortium
Concord Consortium: Smartgraphs: Graphs Tell a Story
Students match a word story to the correct set of graphs involving temperature change over time.
Other
The University of Edinburgh: Discrete Mathematics Graphs
This article is an in-depth look at graphs. Topics covered are graph models, terminology, representations of graphs, graph isomorphism, connectivity, Euler and Hamiltonian Paths, and more. Examples and explanations are included.
Government of Alberta
Learn Alberta: Math Interactives: Exploring Data Display and Graphs
This multimedia Learn Alberta math resource focuses on graphing data. In the video portion, students will see how math is involved in the display of merchandise in stores. The accompanying interactive component provides an exploration...
National Council of Teachers of Mathematics
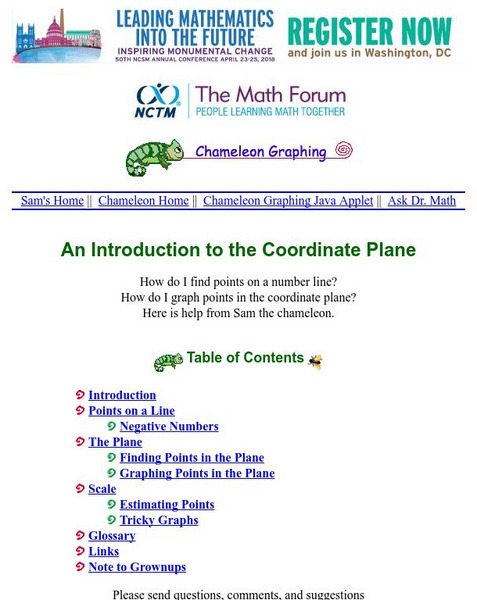
The Math Forum: Chameleon Graphing: Coordinate Plane
Dive into this introduction to graphing in the coordinate plane, and meet a chameleon named Sam. Sam will help guide you through graphing points on a line, using negative numbers, and graphing points in the coordinate plane.
TeachEngineering
Teach Engineering: Using Graph Theory to Analyze Drama
Students analyze dramatic works using graph theory. They gather data, record it in Microsoft Excel and use Cytoscape (a free, downloadable application) to generate graphs that visually illustrate the key characters (nodes) and...
TeachEngineering
Teach Engineering: Graphing Your Social Network
Students analyze their social networks using graph theory. They gather data on their own social relationships, either from Facebook interactions or the interactions they have throughout the course of a day, recording it in Microsoft...
TeachEngineering
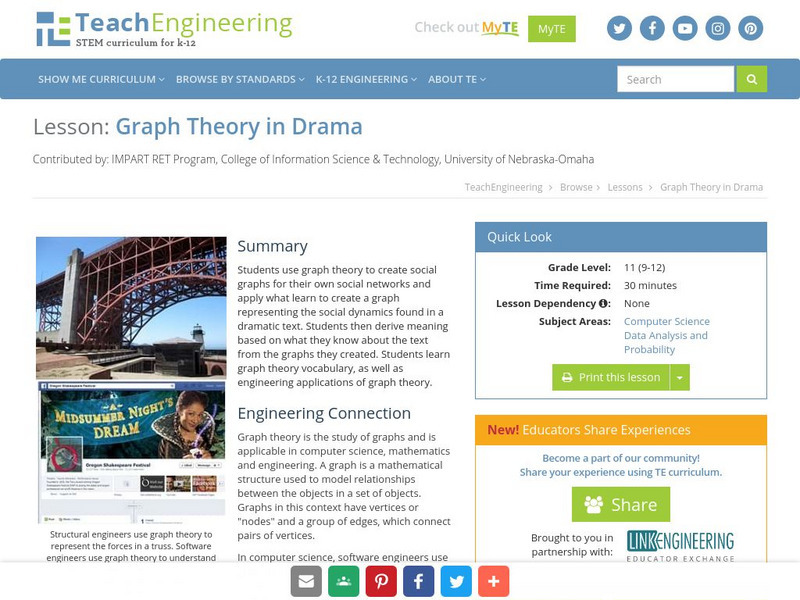
Teach Engineering: Graph Theory in Drama
Students use graph theory to create social graphs for their own social networks and apply what learn to create a graph representing the social dynamics found in a dramatic text. Students then derive meaning based on what they know about...
That Quiz
That Quiz: Practice Test: Graphs
This resource allows users to test their knowledge of graphs and graphing methods.
US Department of Education
Nces Kids' Zone: Create a Graph
Resource from the National Center for Education Statistics allows you to create great bar graphs. Simply enter your information, choose appropriate colors, and voila!- you have a beautiful graph you can turn put into your report!
Shodor Education Foundation
Shodor Interactivate: Lesson: Bar Graph
This lesson is designed to give students practice creating and reading bar graphs as well as understanding how to accurately represent a graph with appropriate units.
Beacon Learning Center
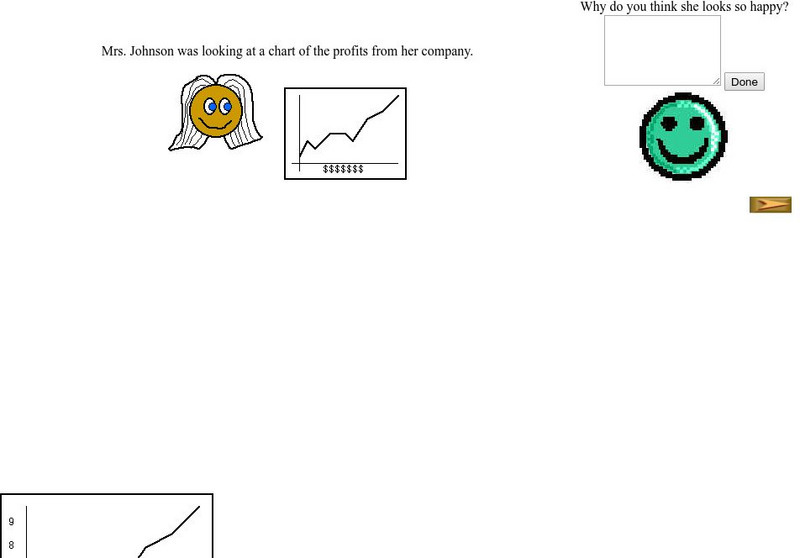
Beacon Learning Center: Interpreting Line Graphs
This site is a lesson on creating and interpreting a line graph. It explains how a line graph is created and then asks questions about what is learned from the data. Students type in open responses, and answers and feedback follow.
Texas Instruments
Texas Instruments: Explore Graphs and Factors
Students use a graphing calculator to explore the relationship between the linear factors of a quadratic function and its zeros. They learn that the x-intercepts and axis of symmetry of a quadratic function can be determined from its...
McGraw Hill
Glencoe: Self Check Quizzes 1 Graphing Functions
Use Glencoe's randomly generated self-checking quiz to test your knowledge of graphing functions. Each question has a "Hint" link to help. Choose the correct answer for each problem. At the bottom of the page click the "Check It" button...
University of Vienna (Austria)
University of Vienna: The Big Function Graph Puzzle
Interactive matching game where linear and quadratic expressions are matched to their associated functions graphs. Site features over 100 graphs, although only six are used at one time.
Oswego City School District
Regents Exam Prep Center: Graphing Trigonometric Functions
This mathematics session investigates how to graph trigonometric functions. The tutorial consists of class notes, calculator tips, examples, and practice problems with solutions. The teacher resource includes methods to produce...
McGraw Hill
Glencoe: Self Check Quizzes 2 Circle Graphs
Use Glencoe's Math Course 2 randomly generated self-checking quiz to test your knowledge of circle graphs. Each question has a "Hint" link to help. Choose the correct answer for each problem. At the bottom of the page click the "Check...
Other popular searches
- Charts and Graphs
- Bar Graphs
- Line Graphs
- Double Bar Graph
- Circle Graphs
- Pie Charts and Graphs
- Picture Graphs
- Coordinate Graphs
- Skittles Bar Graph
- Reading Charts and Graphs
- Blank Coordinate Graphs
- Percent Circle Graph

