EngageNY
Networks and Matrix Arithmetic
Doubling a network or combining two networks is quick and easy when utilizing matrices. Learners continue the network example in the second lesson of this series. They practice adding, subtracting, and multiplying matrices by a scalar...
EngageNY
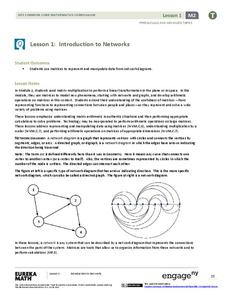
Introduction to Networks
Watch as matrices break networks down into rows and columns! Individuals learn how a network can be represented as a matrix. They also identify the notation of matrices.
Inside Mathematics
Quadratic (2009)
Functions require an input in order to get an output, which explains why the answer always has at least two parts. After only three multi-part questions, the teacher can analyze pupils' strengths and weaknesses when it comes to...
Inside Mathematics
Graphs (2006)
When told to describe a line, do your pupils list its color, length, and which side is high or low? Use a worksheet that engages scholars to properly label line graphs. It then requests two applied reasoning answers.
Inside Mathematics
Rugs
The class braids irrational numbers, Pythagoras, and perimeter together. The mini-assessment requires scholars to use irrational numbers and the Pythagorean Theorem to find perimeters of rugs. The rugs are rectangular, triangular,...
Inside Mathematics
Picking Apples
Getting the best pick of the apples depends on where to pick. The short assessment presents a situation in which class members must analyze a real-world situation to determine the cost of picking apples. The pricing structures resemble...
Inside Mathematics
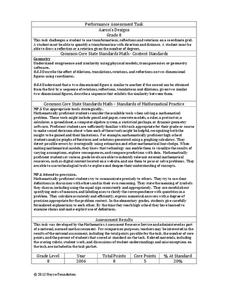
Aaron's Designs
Working with transformations allows the class to take a turn for the better. The short assessment has class members perform transformations on the coordinate plane. The translations, reflections, and rotations create pattern designs on...
Noyce Foundation
Which is Bigger?
To take the longest path, go around—or was that go over? Class members measure scale drawings of a cylindrical vase to find the height and diameter. They calculate the actual height and circumference and determine which is larger.
Noyce Foundation
Pizza Crusts
Enough stuffed crust to go around. Pupils calculate the area and perimeter of a variety of pizza shapes, including rectangular and circular. Individuals design rectangular pizzas with a given area to maximize the amount of crust and do...
Noyce Foundation
Ducklings
The class gets their mean and median all in a row with an assessment task that uses a population of ducklings to work with data displays and measures of central tendency. Pupils create a frequency chart and calculate the mean and median....
Bowland
Pointzero: Confined
Groups plan their escape carefully. Three three-tiered puzzles help a story character escape their situation, each involving integer sequences, transformations, and geometric constructions. The teacher resource includes...
Los Angeles Valley College
Adding and Subtracting Integers
Practice adding and subtracting positive and negative numbers with a forty-problem integers worksheet.
Statistics Education Web
How Wet is the Earth?
Water, water, everywhere? Each pupil first uses an Internet program to select 50 random points on Earth to determine the proportion of its surface covered with water. The class then combines data to determine a more accurate estimate.
Statistics Education Web
What Percent of the Continental US is Within One Mile of a Road?
There are places in the US where a road cannot be found for miles! The lesson plan asks learners to use random longitude and latitude coordinates within the US to collect data. They then determine the sample proportion and confidence...
Statistics Education Web
Are Female Hurricanes Deadlier than Male Hurricanes?
The battle of the sexes? Scholars first examine data on hurricane-related deaths and create graphical displays. They then use the data and displays to consider whether hurricanes with female names result in more deaths than hurricanes...
Statistics Education Web
Double Stuffed?
True or false — Double Stuf Oreos always contain twice as much cream as regular Oreos. Scholars first measure the masses of the filling in regular Oreos and Double Stuf Oreos to generate a class set of data. They use hypothesis testing...
Statistics Education Web
I Always Feel Like Somebody's Watching Me
Future statisticians and potential psychics first conduct an experiment to collect data on whether a person can tell if someone is staring at them. Statistical methods, such as hypothesis testing, chi-square tests, binomial tests, and...
EngageNY
Why Were Logarithms Developed?
Show your class how people calculated complex math problems in the old days. Scholars take a trip back to the days without calculators in the 15th installment of a 35-part module. They use logarithms to determine products of numbers and...
California Mathematics Project
Reflections
Reflections are the geometric mirror. Pupils explore this concept as they discover the properties of reflections. They focus on the coordinates of the reflections and look for patterns. This is the third lesson in a seven-part series.
Statistics Education Web
The United States of Obesity
Mississippi has both the highest obesity and poverty rate in the US. Does the rest of the data show a correlation between the poverty and obesity rate in a state? Learners tackle this question as they practice their skills of regression....
Statistics Education Web
The Case of the Careless Zookeeper
Herbivores and carnivores just don't get along. Using a box of animal crackers, classes collect data about the injury status of herbivores and carnivores in the box. They complete the process of chi-square testing on the data from...
Statistics Education Web
Saga of Survival (Using Data about Donner Party to Illustrate Descriptive Statistics)
What did gender have to do with the survival rates of the Donner Party? Using comparative box plots, classes compare the ages of the survivors and nonsurvivors. Using the same method, individuals make conclusions about the...
Statistics Education Web
Consuming Cola
Caffeine affects your heart rate — or does it? Learners study experimental design while conducting their own experiment. They collect heart rate data after drinking a caffeinated beverage, create a box plot, and draw conclusions....
Statistics Education Web
Types of Average Sampling: "Household Words" to Dwell On
Show your classes how different means can represent the same data. Individuals collect household size data and calculate the mean. Pupils learn how handling of the data influences the value of the mean.


