PBS
Career Connections | Bookkeeping and Accounting
Keeping track of the finances is the job of the accountant and the bookkeeper. Find out what skills add up to make it in the world of ledgers and numbers.
PBS
The Hunger Games
The odds will be in your favor that young statisticians will volunteer to participate in this experiment. After watching a short video that is part of the PBS Math at the Core middle school collection, scholars engage in a lottery and...
PBS
Recognize and Represent Proportional Relationships between Quantities: Ratio, Proportion, Cross Multiply, and Divide
Review three video clips for one major concept. The resource contains three short clips to introduce the idea of ratios and proportions and how to solve a proportion. After watching the video, partners use their noses to push pom poms...
Corbett Maths
Drawing Pictograms
They say a picture is worth a thousand words. Test this theory as classes learn to represent data with pictograms. A video shows pupils how to use pictograms to create a display of data similar to a dot plot. A pair of worksheets offers...
PBS
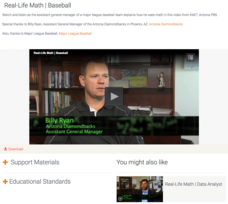
Real-Life Math | Baseball
The math in baseball is more than just batting averages. The Assistant General Manager of the Diamondbacks shows the numerous ways the management uses baseball math. The class participates in an activity to simulate batting averages and...
Scholastic
Study Jams! Identify Outcomes and Make Predictions
Making predictions and identifying possible outcomes are skills that all science pupils should possess. In this video, Mia and Sam discuss the chances of puppies being male or female as an example. The animation is adorable, and will...
PBS
Pbs Learning Media: Real Life Math: Baseball
Watch and listen as the assistant general manager of a major league baseball team explains how he uses math in this video from KAET, Arizona PBS. A lesson plan and handouts are included. [7:43]
Khan Academy
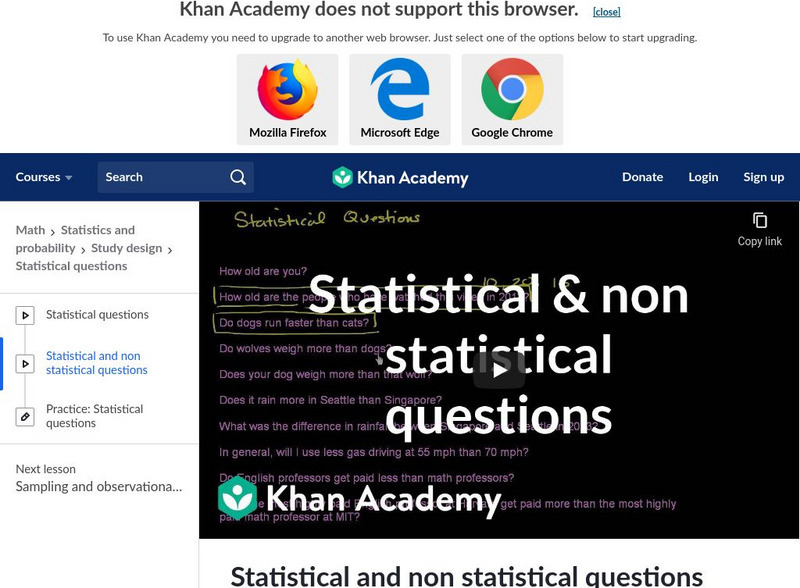
Khan Academy: Statistical and Non Statistical Questions
Looks at the types of questions that statistics can address and explains how to tell the difference between a statistical and a non-statistical question. [7:50]
Sophia Learning
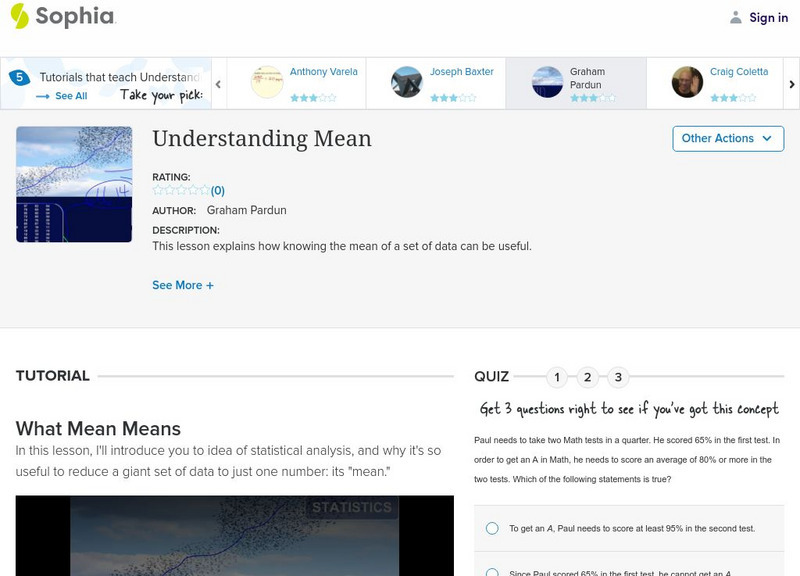
Sophia: Understanding Mean
Determine what the mean of a set of data is and how to calculate it. Assess learning with a quiz.
Imagine Learning Classroom
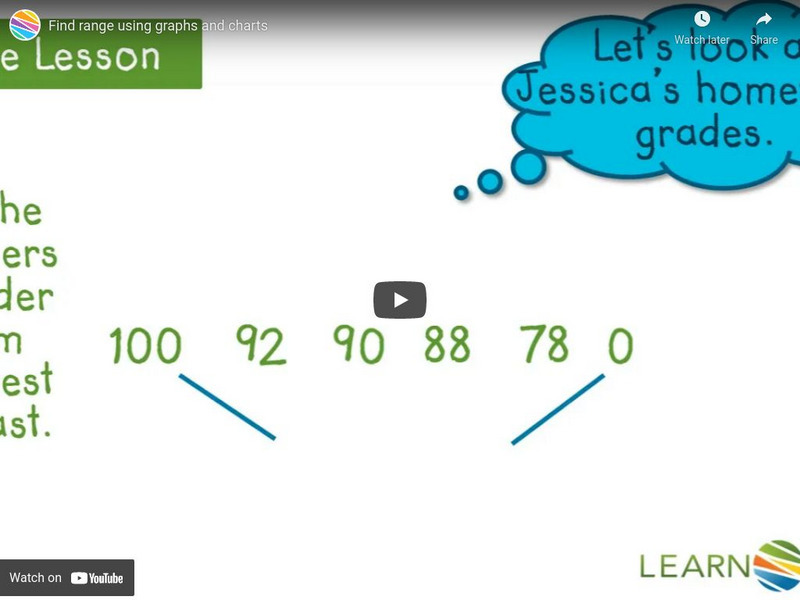
Learn Zillion: Find Range Using Graphs and Charts
In this lesson, you will learn to find the range of a given set of data including and excluding the outlier by using graphs and charts. Login gives access to a slideshow as well. [5:07]
Math Mammoth
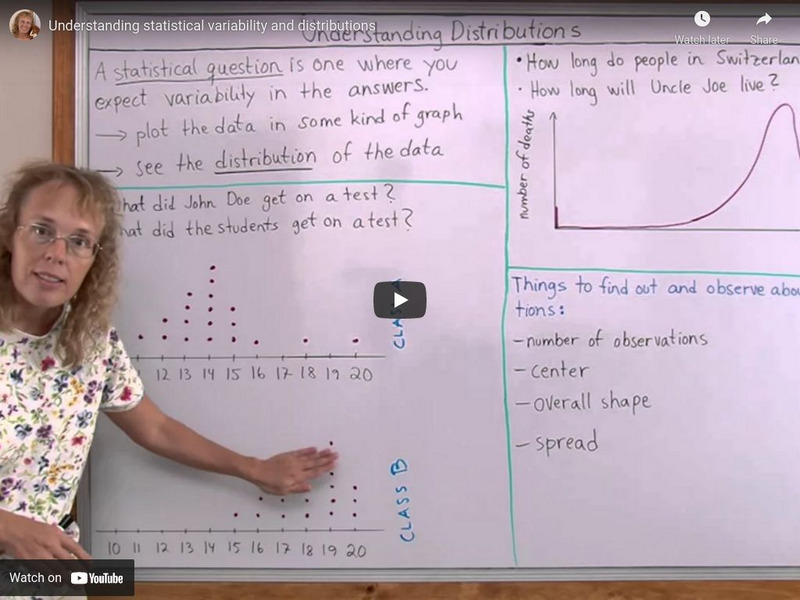
Math Mammoth: Understanding Statistical Variability and Distributions
This lesson explains what a statistical question is and how to describe the distribution of data by its center, spread, and shape. [7:08]
Khan Academy
Khan Academy: Statistical Questions
This video lesson [9:33] provides a discussion of statistical data and types of statistical questions.
Khan Academy
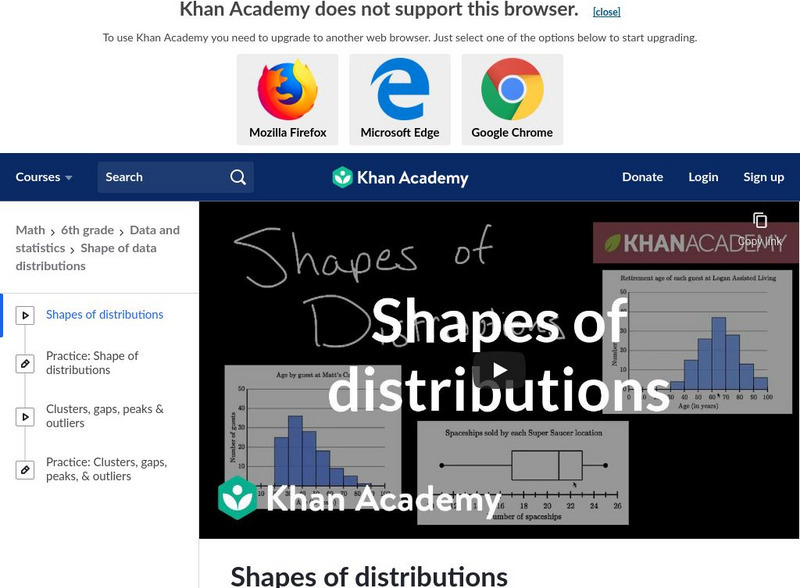
Khan Academy: Shapes of Distributions
This video discusses how to interpret a data display by looking at patterns and anomolies in the shape of its distribution. [5:06]
Shmoop University
Shmoop: Histograms
Explore how to organize data with histograms through this video. [1:21]


