Crash Course
Big Data Problems: Crash Course Statistics #39
The big, the bad, and the ugly of data. The resource picks up from the description of big data and discusses the possible problems. Using examples, the 39th video in the series of Crash Course statistics explains how some use big data...
Crash Course
Science Journalism: Crash Course Statistics #11
Don't let fake news mislead you. A respectable video describes the pillars of science journalism. It explains methods that publications use to try to sensationalize topics or mislead readers and identifies ways to spot such articles.
TED-Ed
How To Spot A Misleading Graph
A source that includes a graph may not always be the best reliable. A short resource highlights how graphs and charts can be misleading. Learners view actual graphs and note the way the graph is distorted to make a point.
Virtual Nerd
Virtual Nerd: How Do You Use a Scatter Plot to Find a Line of Fit
In this video lesson students learn how to graph data on a coordinate plane and draw a line of fit for that data.
Khan Academy
Khan Academy: Statistics: Binomial Distribution 2
Video continuing an example of a binomial distribution for the amount of heads in five flips of a coin by drawing the graph and including discussion on how the distribution relates to a normal bell curve. Also includes explanation of why...
Khan Academy
Khan Academy: Statistics: Binomial Distribution 4
Video demonstration continuing an example of a binomial distribution for the amount of free throw shots made out of six shots. Excel is used to calculate probabilities and graph the distribution. Video is also listed in the probability...
Khan Academy
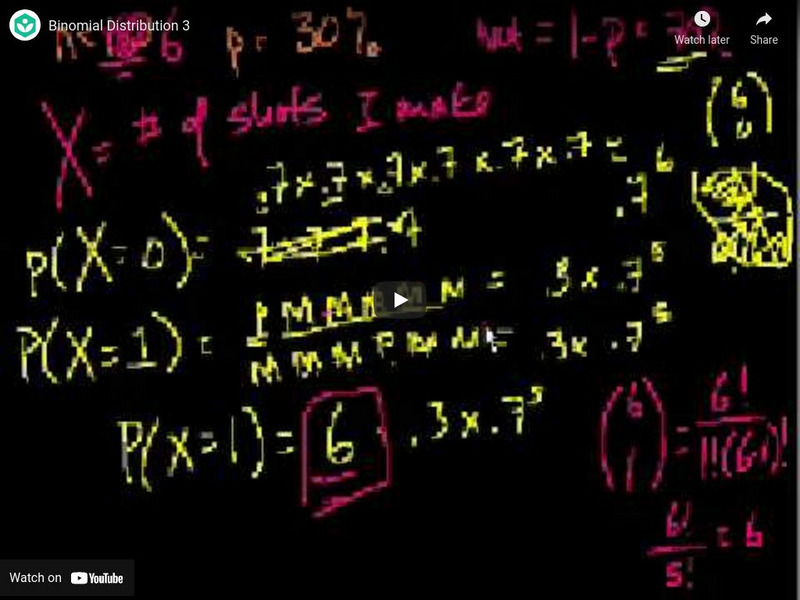
Khan Academy: Statistics: Binomial Distribution 3
Video demonstration of finding the binomial distribution for an example about shooting six free throw shots by calculating the probabilities of each number of shots that were made. Video is also listed in the Probability section of Khan...
Khan Academy
Khan Academy: Statistics: Z Statistics vs. T Statistics
Video gives an explanation of the difference between using z-statistics and t-statistics and when each should be used. [6:39]
Khan Academy
Khan Academy: Inferential Statistics: Confidence Interval 1
Video showing how to determine the probability that the population mean is between two given values when given the mean and standard deviation of a sample. Uses sampling distribution and calculates a z-score in order to determine the...
Khan Academy
Khan Academy: Statistics: Anova 1 Calculating Sst(total Sum of Squares)
Video demonstrates how to calculate the total sum of squares and uses the degrees of freedom to calculate variance. [7:39]
Khan Academy
Khan Academy: Statistics: Mean and Variance of Bernoulli Distribution Example
Video giving example of a Bernoulli distribution and showing how to calculate its mean, variance, and standard deviation leading up to deriving the formulas for mean, variance and standard deviation of a Bernoulli distribution which will...
Khan Academy
Khan Academy: Statistics: Bernoulli Distribution Mean and Variance Formulas
Video example of what a Bernoulli distribution is. Demonstrates how the general formulas for the mean and variance of the distribution are derived. [6:59]
Khan Academy
Khan Academy: Statistics: Difference of Sample Means Distribution
Video shows visually and reviews notation for sampling distributions of random variables. It then visually shows the distribution of the mean of the difference of two random variables and gives the formulas for the mean and variance of...
Khan Academy
Khan Academy: Statistics: Anova 3 Hypothesis Test With F Statistic
Video demonstrates how to calculate an F-statistic and use the F-distribution to determine whether to accept or reject a null hypothesis. [10:14]
Khan Academy
Khan Academy: Statistics: Expected Value E(x)
Video explains the relationship between expected value and population mean and provides an example of calculating expected value using frequencies. [14:53]
University of New South Wales (Australia)
University of New South Wales: Prob Stats6: Binomial and Geometric Distributions
In this lecture for an introductory probability and statistics course, the instructor goes over binomial and geometric distributions, as well as sign tests. [52:21]
Texas Education Agency
Texas Gateway: Study Edge Statistics: Making Predictions
This lesson looks at how to use the line of best fit to make predictions about bivariate data. Includes downloadable study guide with exercises - guide also covers other topics. [8:21]
Texas Education Agency
Texas Gateway: Study Edge Statistics: Interpreting Slope and Y Intercept
This lesson explains how to interpret the slope and the y-intercept for a scatter plot. Includes downloadable study guide with exercises - guide also covers other topics. [7:39]
Texas Education Agency
Texas Gateway: Study Edge Statistics: The Normal Distribution
This lesson discusses the normal distribution and the use of z-scores. Includes downloadable study guide with exercises - guide also covers other topics. [14:58]
Khan Academy
Khan Academy: Statistics and Probability: Study Design: Statistical Questions
Video explaining what the characteristics of a good statistical question are. [9:33]
Khan Academy
Khan Academy: Statistics: Margin of Error 1
Video example of calculating the mean, variance and standard deviation of a sample of a Bernoulli distribution. Video is leading up to creating a confidence interval which will be shown in the next video. [15:02]
Khan Academy
Khan Academy: Statistics: Margin of Error 2
Video continues from previous video to show how to create a confidence interval for the population mean from a sample taken from a Bernoulli distribution. [10:05]
Khan Academy
Khan Academy: Statistics: Normal Distribution Excel Exercise
Video discusses the importance of the normal distribution. The formula for the normal distribution is given and explained. A url is given where an excel spreadsheet can be downloaded which is shown and used to compare the binomial...
PBS
Pbs Learning Media: Real Life Math: Baseball
Watch and listen as the assistant general manager of a major league baseball team explains how he uses math in this video from KAET, Arizona PBS. A lesson plan and handouts are included. [7:43]


