Curated OER
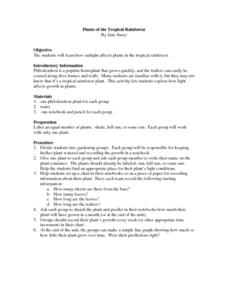
Plants of the Tropical Rainforest
Students experiment with the growth of philodendron plants in different amounts of sunlight. They complete a gardening notebook including plant sketches and growth data.
Curated OER
Design, Spin, and Graph
Learners participate in a spinner activity and graph the results. They spin 10 times, tally the results, and discuss why the results occurred.
Curated OER
ExplorA-Pond:3rd Grade Probability
Third graders cut a map of a pond into grid squares. They count the total number of squares and calculate the probability of drawing a pond piece vs. a shoreline piece. They draw 10 pieces and compare the results with the original...
Curated OER
Centennial: Secrets From Beyond...
Fourth graders identify cemeteries as a source of information for historical research. They consider the types of information cemeteries can provide, review local headstones and create a database of the collected knowledge.
Curated OER
Statistical Specimens
Third graders are introduced to statistical vocabulary. They complete an online activity that asks them to calculate the mean, median and mode for a set of data.
Curated OER
Probability or Ability?
Students fill in a probability chart while attempting to catch candy with their non-dominant hands. They replicate the activity with a coin.
Curated OER
Probability or Ability?
Students toss candy and coins using their non-dominant hand while their partners records the results on a probability charts.
Curated OER
Probability or Ability?
Students use their non-dominant hand to catch candy which they tossed in the air. They estimate how many they catch in a second round. They record and determine how the probability changed the second time.
Curated OER
Using Statistics to Uncover More Evidence
Fifth graders participate in an online Web lesson plan on ways of interpreting data. They conduct a survey and interpret the results in a journal entry.
Curated OER
M&M Graphing and Probability
Students create a variety of graphs. They count, sort, and classify M&M's by color and record data on a chart. They use data from the chart to create pictographs, bar graphs and circle graphs. They analyze data and determine...
Curated OER
Turkeys or Eagles?
Students discuss how Benjamin Franklin wanted the wild turkey (not the bald eagle) to be our national bird and then graph their preferences and discuss the survey results.
Curated OER
Outer Space and Cyber Space
Fourth graders learn about the Solar System while they use mean, median and mode to explore the characteristics of the planets. Students web publish expository writing.
Curated OER
Guess the Card -Probability
This site is used for distance education purposes and professional development of teachers


