Houghton Mifflin Harcourt
Unit 1 Math Vocabulary Cards (Grade 1)
Reinforce mathematical vocabulary with the use of flash cards. Each card showcases a boldly typed word as well as a labeled picture representation of the word. Terms include addition, subtraction, greater than, less than, and more!
Los Angeles County Office of Education
Assessment for the California Mathematics Standards Grade 3
Assess scholars' knowledge with a 22-page assessment that covers place value, patterns, probability, estimation, measurement, geometric figures; and their ability to add, subtract, multiply and divide proficiently.
Los Angeles County Office of Education
Assessment for the California Mathematics Standards Grade 1
Here is an assessment designed to test mathematicians' knowledge of writing numbers, comparing numbers, skip counting, solving addition and subtraction problems; along with measuring objects, telling time, identifying shapes, reading...
Los Angeles County Office of Education
Assessment for the California Mathematics Standards Grade 2
Test scholars mathematic skills with an assessment addressing addition, subtraction, multiplication, place value, measurement, geometric shapes, expanded notation; and their ability to compare numbers, write number sentences, draw...
Classrooms in Action
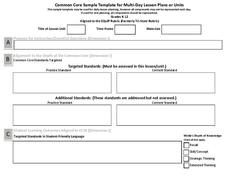
Common Core Sample Template for Multi-Day Lesson Plans or Units
Make sure you've covered all your bases when designing a Common Core unit. From essential questions and standards alignment to instructional supports and reflections, this template will guide you toward completing a comprehensive,...
Curated OER
Take a Chance on Probability
Connect ratios, probability, and combination outcomes with a challenging activity idea. It guides your learners through probability of an event as fractions or ratios, on a number line, and with correct vocabulary. The class will be...
Scholastic
Study Jams! Mode
Sam is running for class treasurer and Zoe wants to know if he won the election. Follow along as she counts up the votes and uses the mode to determine the winner. After viewing the presentation, work through the Try It! practice...
SEN Teacher
Maths Spinner
Create a custom spinner to use for classroom or mathematical purposes. There is the option to pick from two, three, four, or six segments with the ability to chose the text for each segment. The font can be multi-colored or plain black....
Curated OER
TE Activity: A Tornado in My State?
Students study data about tornadoes in the United States while completing a worksheet. They develop a bar graph showing the number of tornadoes for the top ten states in the US. They find the median and mode of the data set.
Curated OER
Bubbles Galore
Learners investigate bubbles. In this science lesson, students observe how long bubbles last and graph the results of the experiment.
Curated OER
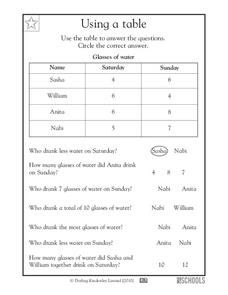
Using a Table
Tables are no help if your scholars can't read them; provide some excellent beginner-practice using this table example and accompanying comprehension questions. Learners examine the data first, which charts the number of glasses of water...
Curated OER
Reading Tally Chart
As learners explore data analysis have them practice reading tally charts using these examples. They answer basic questions about each of three charts, employing addition and subtraction skills. For example, a chart tallying t-shirts...
Curated OER
Bar Graphs
What are these bar graphs depicting? Novice data analyzers examine two basic bar graphs and answer three comprehension questions about each. The first graph shows tickets sold per date and the next is distances run per member of a cross...
Curated OER
Bar Graphs and Pictographs
How are bar graphs and pictographs different? As you begin this concept, use these simple graphs to help get learners started with data analysis styles. There is one bar graph and one pictograph, each accompanied by four or five...
Curated OER
Using Bar Graphs
What's your favorite pizza topping? Scholars analyze two bar graphs, one depicting a math club's favorite pizza toppings and the other ice cream sales per flavor. As they examine the graphs, learners answer a few comprehension questions....
Curated OER
Pictographs
What do these pictographs show? Scholars analyze three sets of data organized into pictographs, filling in several comprehension questions about each. The first one is done for them as an example, but consider going over it together to...
Curated OER
Probability
What's the probability your scholars will enjoy this instructional activity? Pretty high, especially for visual learners. They examine a table of types of beads in a grab bag. Pupils determine which type is most likely to be picked and...
Curated OER
What Contains Carbon?
Students explore elements by analyzing everyday objects and materials in class. In this carbon lesson, students define several vocabulary terms such as carbon dioxide, hydrocarbon, and carbonate. Students view a group of items,...
Education World
The African American Population in US History
How has the African American population changed over the years? Learners use charts, statistical data, and maps to see how populations in African American communities have changed since the 1860s. Activity modifications are included to...
Curated OER
Averages: Mean, Median, Mode
After reviewing the process of finding the mean, median, mode, and average of a given data set, learners work through several practice problems. There are five problems related to mode, and five related to finding the mean. Great as...
Curated OER
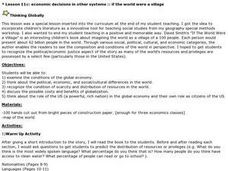
If the World Were a Village...
Your class members explore concept that the world is a large place, examine how statistics can be used to help in understanding the world and its people, and create illustrations or graphs of statistics found in the award-winning...
Education World
Putting Turkey on a Table (or a Graph)
Grateful learners put turkey on a table (or a graph)! Through a creative project they show statistical information about turkey population, production, and consumption. A great Thanksgiving lesson that can be applied at any time to the...
Curated OER
Probability and Statistics
Elementary schoolers choose from a host of activities to investigate probability and statistics. They complete worksheets, create 3-D graphs, and play graph bingo. They make weather predictions and list all the possibilities before going...
Curated OER
Chocolate Graphing
Chocolate lovers develop a bar graph based on the types of chocolate the class likes. They participate in The Art of Chocolate at The Hershey Story before they make a bar graph that shows the favorite chocolate types of their class. They...


