Curated OER
Dental Detectives
First graders explore the theme of dental health and hygeine. They make tooth loss predictions, count lost teeth, and graph tooth loss. In addition, they listen to dental health stories, read online stories, create spreadsheets, and play...
Curated OER
A Day at the Beach
Let's go to the beach! Danielle, Marty, and Phil collected shells at the beach. Can you determine how many shells each child has? Create a picture graph to make the data easier to understand.
Curated OER
Hats for Sale
What type of hat do you think sells the best? Elementary learners will use the picture graph provided to answer the comprehension questions. A chart accompanies the picture graph, so youngsters can see the data multiple ways.
Curated OER
School Activities
First graders place some specific types of objects (e.g., shoes, favorite food) on concrete graphs and pictographs. They listen and respond to others in a variety of contexts (e.g., pay attention to the speaker; take turns speaking in a...
Curated OER
One
First graders listen to the story One and design a favorite color graph. In this language arts lesson plan, learners answer comprehension questions and discover the importance of standing up for a friend. They complete a worksheet...
Baylor College
What Makes Water Special?
Get close up and personal with a drop of water to discover how the polarity of its molecules affect its behavior. Elementary hydrologists split and combine water droplets, and also compare them to drops of oil. Much neater than placing a...
Baylor College
Heart and Lungs
With a partner, youngsters measure their pulse and breathing rates, both at rest and after running in place for a minute. While this activity is not novel, the lesson plan includes a large-scale classroom graphing activity and other...
Baylor College
Dust Catchers
In class, your emerging environmentalists construct dust catchers. They take them home for a week or two, and then bring them back into class to examine under a magnifier. From this activity, they learn what makes up dust and that...
Curated OER
Graphing Our Favorite Candy Bars
Students use ClarisWorks to graph class' favorite candy bars on a bar graph.
Curated OER
Moooooove into Graphing
First graders explore graphing software and create their own graph of farm animals. Then students analyze their graph using the teacher made worksheet which is imbedded in this lesson plan. Great lesson plan!
T. Smith Publishing
Easter Graphing Worksheet
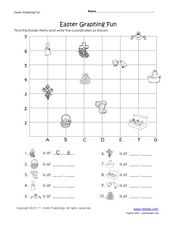
A large graph takes up most of this instructional activity. On it are Easter-themed icons for which learners must identify and write down the coordinates for. Note that there are religious symbols included in the icons which would not...
Curated OER
Math, Sweet Math Activity Sheet
In this candy graphing learning exercise, 1st graders will place candy on their paper to create a bar graph. They will answer several questions based on their data. A teacher checklist is provided.
Curated OER
Valentine's Day Math
First graders explore sorting and classifying. In this math lesson, 1st graders sort conversation hearts based on color. Students graph their results and enjoy the candy!
Curated OER
Chicken Pox Math
Students will listen to a story of a boy with chicken pox and participate in a class discussion of chicken pox and what to do when you have a contagious disease. They will incorporate math by graphing who in the class has had the...
Curated OER
Grand Grocery Graphs
Students experience creating their own graphs on graph paper and the computer program "Graph Club." They approach this task by utilizing food as their primary source for the activities. In addition, they interact with their peers as they...
Curated OER
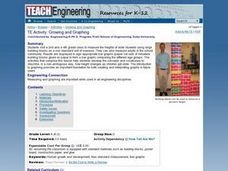
Growing and Graphing
Learners visit a 2nd and a 4th grade class to measure the heights of older students using large building blocks as a non-standard unit of measure. They can also measure adults in the school community. Results are displayed in...
Curated OER
Weather Graphs
First graders use their knowledge of weather symbols to organize and construct a graph of the daily weather for one month. Each student have a chance to give the daily weather report using Sammy's Science House Computer Software.
Curated OER
Vertical Bar Graph
In this math worksheet, students create a vertical bar graph. Students choose 5 items to compare and record data up to 20 units.
Curated OER
Math Center: Fishing
In this math worksheet, students reinforce addition and subtraction facts 0 to 12 by collaborating in a fishing game. Students fish for numbers with a magnet and create a math sentence, flipping a coin to determine the operation used....
Curated OER
Valentine M&M's Math
In this Valentine M&M's math activity worksheet, students count their M&M's, sort them by color, make a pattern with them, and create a graph showing how many of each color they have.
Curated OER
100th Day Graphing
In this counting worksheet, students will use jellybeans or M&Ms for graphing the different colors. Students will sort the candies by color and count how many they have of each.
Curated OER
Study the Graph
For this graph worksheet, students study colored shapes plotted on a Cartesian coordinate plane. Students identify the "right" and "left" coordinates for each shape. The page should be duplicated in color.
Curated OER
Veggie Chop and Data Analysis
First graders chop vegetables into fractions. In this fractions lesson, 1st graders cut vegetables, collect data about favorite vegetables and create a bar graph using the information. Students make inferences about the data and...
Other popular searches
- Charts and Graphs Math
- Hidden Picture Math Graphs
- Misleading Graphs Math
- Powerpoint Math Graphs
- 1st Grade Math Graphs
- Math Graphs 4th Grade
- Math Reading Graphs
- Animals Math Graphs
- Math Graphs Grade 1
- Creating Math Graphs
- Math Graphs Using M&ms
- Math Interpreting Graphs


