Curated OER
Graphing Favorite Holidays
Students create spreadsheets and bar graphs based on results of survey of favorite holidays.
Curated OER
M & M Madness
M&M's are always a great manipulative to use when teaching math. In this graphing lesson plan, learners predict how many of each color of M & M's there are. They count up each color and plug the data into a graph using the...
Alabama Learning Exchange
Yummy Apples!
Young learners listen to a read aloud of Gail Gibbons book, Apples and the story A Red House With No Windows and No Doors. They compare characteristics of a number of kinds of apples, graph them and create a apple print picture. Learners...
Curated OER
Dental Detectives
First graders explore the theme of dental health and hygeine. They make tooth loss predictions, count lost teeth, and graph tooth loss. In addition, they listen to dental health stories, read online stories, create spreadsheets, and play...
Curated OER
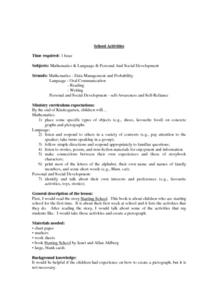
School Activities
First graders place some specific types of objects (e.g., shoes, favorite food) on concrete graphs and pictographs. They listen and respond to others in a variety of contexts (e.g., pay attention to the speaker; take turns speaking in a...
Curated OER
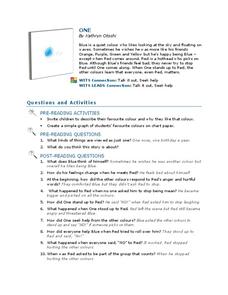
One
First graders listen to the story One and design a favorite color graph. In this language arts lesson plan, learners answer comprehension questions and discover the importance of standing up for a friend. They complete a worksheet...
Baylor College
What Makes Water Special?
Get close up and personal with a drop of water to discover how the polarity of its molecules affect its behavior. Elementary hydrologists split and combine water droplets, and also compare them to drops of oil. Much neater than placing a...
Baylor College
Dust Catchers
In class, your emerging environmentalists construct dust catchers. They take them home for a week or two, and then bring them back into class to examine under a magnifier. From this activity, they learn what makes up dust and that...
Baylor College
Heart and Lungs
With a partner, youngsters measure their pulse and breathing rates, both at rest and after running in place for a minute. While this activity is not novel, the lesson plan includes a large-scale classroom graphing activity and other...
Curated OER
Chicken Pox Math
Students will listen to a story of a boy with chicken pox and participate in a class discussion of chicken pox and what to do when you have a contagious disease. They will incorporate math by graphing who in the class has had the...
Curated OER
Moooooove into Graphing
First graders explore graphing software and create their own graph of farm animals. Then students analyze their graph using the teacher made worksheet which is imbedded in this lesson plan. Great lesson plan!
Curated OER
Math, Sweet Math Activity Sheet
In this candy graphing learning exercise, 1st graders will place candy on their paper to create a bar graph. They will answer several questions based on their data. A teacher checklist is provided.
Curated OER
Weather Graphs
First graders use their knowledge of weather symbols to organize and construct a graph of the daily weather for one month. Each student have a chance to give the daily weather report using Sammy's Science House Computer Software.
Curated OER
How Do You Like Your Eggs?
First graders conduct a poll about how people like their eggs. In this graphing lesson, 1st graders collect data about how they like their eggs. Students use a picture of themselves to place under the type of egg they like. Students then...
Curated OER
THE EASTER BUNNY GETS READY! PICTURE GRAPH
In this graphing learning exercise, students read a picture graph about colors of Easter eggs and then answer questions about the graph.
Curated OER
Valentine Candy Count
Students analyze a bag of Valentine candy to create a graph. In this graphing lesson, students make predictions, sort by color, record data and make a graph. Students discuss results and make generalizations. Students generate their own...
Curated OER
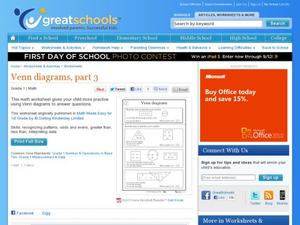
Venn Diagrams, Part 3
Can your first graders interpret Venn diagrams? Different sets of clues help pupils narrow down a specific number in different shapes. They determine odds and evens, greater than or less than, and what shape the number is in. A fun...
Curated OER
Rolling with Links
First graders explore geometry by completing a worksheet in class. In this non-standard measurement unit lesson, 1st graders discuss different techniques for measuring items without the use of a ruler. Students read several short stories...
Curated OER
Berlioz the Bear
Young children read the story, Berlioz the Bear and complete various reading and writing activities. They learn about fiction and non-fiction, and complete graphing and writing activities for the story. Youngsters draw the bear and use...
Curated OER
The Gummywolf
Learners read a story about "Gummywolf," stopping periodically to answer questions about the progression of the story. Next, they create a Venn Diagram to compare and contrast "Gummywolf" to "Goldilocks and the Three Bears." Students...
Curated OER
Data Analysis: For Little Learners
Using pictographs, tally charts, and surveys, kids learn all about data analysis and collection. They make surveys, collect data, then construct pictographs and tally charts to organize their information.
Curated OER
Field Trip To The Fire Station
Students read and discuss fire safety and discover celebration of Firefighters' Day in various countries. They identify firefighting equipment, draw trucks, ambulances, ladders and other equipment. Students predict the type of equipment...
Curated OER
Getting There
Students practice reading a pictograph. In this data analysis lesson, students collect data and create their own pictograph. A students worksheet is included.
Curated OER
Heart to Heart
Learners predict the outcome of a question and conduct a survey and record their findings on a bar graph.


