Curated OER
Data and Probability: What is the Best Snack?
In this math/nutrition instructional activity, the nutritional value of 3 snack foods is recorded on a data chart and represented on a bar graph. Young scholars analyze and compare information, construct data charts and related bar...
Curated OER
Reading Bar Charts
Help kids understand how to collect data through surveys, organize data in a bar chart, then analyze their findings. There are three different surveys for learners to conduct, a full description of all the parts of a bar chart, and three...
Curated OER
Data Analysis: For Little Learners
Using pictographs, tally charts, and surveys, kids learn all about data analysis and collection. They make surveys, collect data, then construct pictographs and tally charts to organize their information.
Curated OER
What's Data?
Students get the opportunity to investigate the concept of data collecting. They explore how to tally and read a bar graph. Vocabulary about data is also be included. At the end of the instructional activity, individual students collect...
Curated OER
Build a Bar Graph
Learners discover how to use bar graphs. They will gather and organize specific data in order to put it into a bar graph. Then they will answer several questions based on the information they have graphed.
Curated OER
Survey and Tally
Second graders view a model of a survey and tally. In this survey and tally lesson, 2nd graders decide on questions for a survey. Students conduct the survey and tally their results. Students create a tally chart. Students view a...
Curated OER
Calculating Buttons
Students, after reading "The Button Box" by Margarette S. Reid, analyze real-world data by surveying a sample space. They predict the generalization onto a larger population utilizing calculators and computers. Students total categories,...
Curated OER
Favourite Colours
In this colors worksheet, learners survey 20 people on what their favorite color is. They mark the results using tallies. Students then take their data and put the totals in a frequency table.
Curated OER
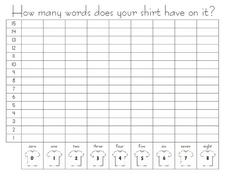
How Many Word Does Your Shirt Have on It? --class Bar Graph
In this math worksheet, students participate in a group bar graph activity. Students survey classmates about how many words, if any, are on their shirts. Results are plotted on a bar graph.
Curated OER
Graphic Favorite Breakfast Foods
Second graders graph data based on a class survey of their favorite breakfast foods. For this graphing lesson plan, 2nd graders take a class survey of their favorite breakfast foods. Then they take that data and put it into a computer...
Curated OER
Graphing Pockets
Second graders explore graphing. They count the number of pockets on their clothes and use Microsoft Excel to enter their data. Students create a class graph displaying their findings.
Curated OER
Eye Color
Young scholars take a survey on eye color and plot their findings into a graph. In this eye color lesson plan, students take a class survey of everyone's eye color and learn how to put those findings into a graph.
University of Kansas
Newspaper in the Classroom
Newspapers aren't only for reading—they're for learning skills, too! A journalism unit provides three lessons each for primary, intermediate, and secondary grades. Lessons include objectives, materials, vocabulary, and procedure, and...
Curated OER
Graphing
Students investigate graphing. In this bar graph lesson, students view an informational website about graphing, then construct a class birthday bar graph outside with sidewalk chalk. Students choose a survey topic, then collect data and...
Curated OER
How Long? How Wide?
Second graders distinguish between and use nonstandard and standard units of measurement, use appropriate tools and techniques to measure length and width, and record and interpret data using graphs.
Curated OER
Green Food Graph
Young scholars explore graph making by investigating St. Patrick's day food. In this holiday food lesson, students discuss their favorite green foods in honor of St. Patrick's day. Young scholars create a graph based on the data of which...
Curated OER
Graphing Favorite Holidays
Students create spreadsheets and bar graphs based on results of survey of favorite holidays.
Curated OER
What's Your Favorite Stuffed Animal?
Second graders gather information in a survey and interpret the results using a tally chart, a table, and a bar graph. They' present their results of the during the final group discussion. The subject of the survey is favorite stuffed...
Curated OER
Growing Up With A Mission
Student measure heights and graph them using growth charts for which they find the mean, mode, and median of the data set. They graph points on a Cartesian coordinate system.
Curated OER
Go The Distance Car Construction
Learners build and program a car to drive a specific challenge distance.They must at the end of the lesson, have the car that stops the closest to a challenge distance.
Curated OER
My Test Book: Story Problems
In this math skills practice activity, students solve 10 multiple choice math problems that require them to respond to story problems.
Curated OER
M&M Math
Students sort a bag of M&M candies according to color using a sorting mat. They count M&M candies. They compare the number to their prediction then students create tally charts.
Curated OER
Jelly Belly: What a Wonderful "Bean"!
Students explore how jelly beans are produced. They discuss the origins of the jelly bean and view a video about how jelly beans are prepared, tested, shaped, finished, and shipped and estimate the amount of jelly beans in a jar and sort...
Curated OER
RCX Car Line Graph
Students develop a line graph based on distances that an RCX car drives in specified amounts of time. They then are given a specific amount of time for the car to drive and be asked to extrapolate the car's distance from the graph.


