National Security Agency
Starting a Restaurant
Through an engaging unit, chefs-in-training will sort and classify data using tally charts. Learners will also create bar graphs to display restaurant data and interpret data from bar graphs using a variety of categories....
Curated OER
Right on the Money
Students watch a video about different ways of making the same amounts of money and view a clip about the Denver Mint to discover how coins are made. They complete a Web activity on each coin's worth and find out facts about the penny.
Curated OER
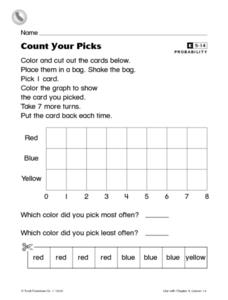
Count Your Picks
In this probability worksheet, students cut out 3 color cards and place them in a bag. Students pick a card out of the bag 8 times, putting the card back each time. Students record their results on a bar graph.
Curated OER
Roll On Down!
Students create number sentences by rolling two dice. Each student rolls the dice and writes down the numbers in number sentence format. Then they add the problem by using the strategies of counting on and doubles.
Curated OER
Heads-Up Probability
Second graders use tree diagrams to predict the possible outcomes of coin tosses. The data they collect and graph also help them predict the likelihood of getting heads or tails when tossing coins the next time.
Curated OER
Three Coins on a Table
Students discuss the subject of coins and heads and tails. They work in groups to solve Fran's problem concentrating on the fact that the coins are in a row. Any group that finishes early can try the Extension problem.
Curated OER
Multiplication Using Arrays, Number Lines, and Repeated Additions
An educational article can be as useful a tool as a good lesson. This article focuses on how one can use arrays, repeated addition, and number lines to reinforce a deeper understanding of multiplication. Links to 5 different worksheets...
Alabama Learning Exchange
Jelly Beans Add Up
Students explore counting, sorting, and graphing skills. In this data analysis lesson, students sort jelly beans by color, count the jelly beans, and create a bar graph of the jelly beans according to color.
Curated OER
Science of Special Effects
This is a creative, multidisciplinary, well-designed instructional activity provided by Scientific American related to special effects. Students make their own animated short films and use math and computer skills.
Curated OER
The Blues . Writing . Biographies/Profiles . The Soul of a Man
This activity, focused on profile writing and its unique characteristics, considers the profiles developed in the film The Soul of a Man while also asking students to consider other profiles they are familiar with and to write some of...
Curated OER
Squanto's Science Lesson
Students explore Squanto's contribution to the settlers. They plant seeds and follow instructions for water and fertilization. Students keep a record of the growth of the seeds. They write a paragraph that tells what they learned from...
Curated OER
Probability Plus
Students participate in a variety of activities to understand statistics. They collect and interpret data. Also students distinguish the difference between a population and a sample. They make inferences and create arguments using data.
Curated OER
Using Graphs and Charts
Students complete T charts and manipulate numbers using graphs and charts. In this math graphs and charts lesson plan, students review the concepts of pattern and function. Students then complete practice pages where they manipulate...
Curated OER
Working Watermelon
You're going to wish you had a watermelon for this lesson! Class members read about watermelons and make a salad in class to sample. They also perform estimates, measurements and calculations on a watermelon. They predict what percentage...
Curated OER
By The Pound
Students develop mathematical skills using measurement in the form of weight. They also perform calculations to find cost and strengthen estimation skills while comparing the actual price. The context for the lesson is in the industry of...
Curated OER
Tulip Graphing
Students create a graph of tulip growth. For this data analysis lesson, students plant tulip bulbs and use graph paper to begin graphing data on the growth of the tulip.
Curated OER
‘Tis The Season . . .To Do Math
Dreidels, Christmas trees, shopping, and snowflakes--what do they all have in common? Mathematics.
Curated OER
Magnets and Interactions
Second graders discover what magnets can do. In this magnet lesson students make predictions about magnets. They experiment with the magnets and record their data on a chart.
Curated OER
The Estimation Station
Students challenge "common knowledge" against newly learned estimation strategies and put those strategies into use. They consider variables in estimating different groups of objects and practice skills of representing numbers.
Curated OER
Next Year's Seeds
Reading, a math game, and a simulation activity provide the engagement on a lesson about seeds and crops. Learners in grades two through four read an informational passage about crops, seeds, and farming. They highlight important...
Curated OER
Cross Country Adventure
Students practice measurement and geography in this lesson. They build a Lego vehicle using an RCX. They predict how many seconds it will take their vehicle to reach a specific state on the United States of America map that each group of...
Curated OER
Identify, Sort, Classify
Learners improve their identifying, sorting, and classifying skills. In this categorizing lesson plan, students use cubes to practice their sorting, classifying, and identification skills.
Curated OER
How Long? How Wide?
Second graders distinguish between and use nonstandard and standard units of measurement, use appropriate tools and techniques to measure length and width, and record and interpret data using graphs.


