Curated OER
"Eggs-ploring" Math with Jellybeans
Learners work in pairs with a small bag of jellybeans to estimate the number of candies in their bags and then figure out how many groups of 10 jellybeans are contained in their bags. They then graph the information using a pictograph or...
Growing Minds
Growing Minds: Cabbage Exploration
It's all about cabbage in this scientific observation resource! After reading a related story, learners explore three varieties of cabbage. They observe the leaves using a leaf diagram, predicting what the middle might look like. They...
Curated OER
Graph Club 2.0 Matching
Second graders study graphing using pictographs and bar graphs. They graph pie charts, line graphs, and also change the graph scale up to 1000. They use the pictograph on the left to create the same graph on the right using a bar graph.
Curated OER
Comparing Data on Graph A and Graph B
Second graders gather and graph data. In this graphing lesson, 2nd graders collect data and graph this information using tally charts, bar graphs, pictographs, or tables. They make predictions about the outcomes.
August House
The Contest Between the Sun and the Wind
Learn the moral of the story with a series of activities about Aesop's fables. Focusing on The Contest Between the Sun and the Wind, learners complete a graphic organizer to discuss who, what, how, and why the events occur. Additionally,...
Curated OER
Graph Your Foot!
Students measure their own foot and place the outline on a graph. They make connections between the size of their foot and the bar graph that represents it.
Curated OER
Celebrate Hispanic Heritage Month!
Students use information from the U.S. Bureau of the Census to create a bar graph, a picture graph, or a circle graph showing the country of origin of U.S. Hispanics.
Curated OER
Color Tile Graphing
Students explore data. They gather data and generate questions about the data in pictographs, tallies, tables, and bar graphs. Students use color tiles pulled by random to create their own bar graph. They discuss the bar graphs they...
Curated OER
Charting Animal Life Spans
Second graders research animal life spans and complete related math activities. In this life span lesson, 2nd graders read How Many Candles and discuss life spans. Students arrange animal cards based on their life spans. Students find...
Curated OER
Birthdays
Students collect data about the birth months of each classmate using a calendar. They make a table with the information before designing a pictograph using cupcake images. They answer questions using the graph.
Curated OER
Organizing And Reading Data
Learners complete three parts of an "Organizning and Reading Data" worksheet. First, they go over the rubric to determine the work will be scored. They organize data by taking tallies, make a pictograph and a bar graph using the data....
Curated OER
Write From the Beginning
Students discuss the earliest form of writing, pictographs and view several examples. They then create their own hieroglyphics and write a short story using them. They then create and label a timeline including methods of writing prior...
Curated OER
Balloon Jets
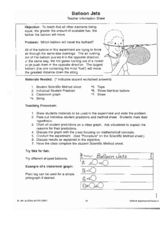
Students investigate how fuel amount affects the distance traveled by balloons. In this physics lesson, students collect data and create a pictograph. They interpret data and formulate a conclusion.
Curated OER
The Gathering and Analysis of Data
Young mathematicians gather data on a topic, graph it in various forms, interpret the information, and write a summary of the data. They present their data and graphs to the class.
Curated OER
Graphing Data
Second graders examine how to make and read bar graphs. In this bar graph lesson, 2nd graders compare bar graphs to pictographs by looking at hair color survey data. They practice making a bar graph and finding the range of the data.
Curated OER
Tracks are for Trains
Second graders collect data on different forms of transportation and create a bar graph or pictograph with the information.
Curated OER
Can You Measure Up?
Here is a well-designed lesson plan on common standards of measurement for your young mathematicians. In it, learners calculate measurements in standard and non-standard units. They make predictions, record data, and construct and design...
Alabama Learning Exchange
Ice Cream Sundae Survey
Young scholars analyze data through graphs. They will complete a class survey on ice cream sundaes and tally and graph the responses. They then analyze the information from the class graph.
Alabama Learning Exchange
Yummy Apples!
Young learners listen to a read aloud of Gail Gibbons book, Apples and the story A Red House With No Windows and No Doors. They compare characteristics of a number of kinds of apples, graph them and create a apple print picture. Learners...
Curated OER
When Ants Fly
Here is a great lesson on constructing line graphs. Learners identify common characteristics of birds, ants common needs of all living things. They also write a story from the perspective of an ant or a bird that has lost its home and...
Curated OER
Build a Bar Graph
Learners discover how to use bar graphs. They will gather and organize specific data in order to put it into a bar graph. Then they will answer several questions based on the information they have graphed.
Curated OER
Virtual Winter Count
Learn more about the North American Plains Indian tribes and their unusual methods of recording historical events. Learners examine the winter count, a custom by which these groups illustrated information after each winter passed. They...
Curated OER
What's Data?
Learners get the opportunity to investigate the concept of data collecting. They explore how to tally and read a bar graph. Vocabulary about data is also be included. At the end of the lesson, individual students collect data independently.
Curated OER
Garbage Plants
Students create plants out of garbage. They identify items that can be recycled and discuss natural resources. They share their creation with the class.
Other popular searches
- Data Analysis Pictograph
- Pictograph Worksheet
- Bar Graphs Pictographs
- Pictographs and Bar Graphs
- Tally Charts and Pictographs
- Mystery Picture Graph
- Tally Charts or Pictographs.
- Pictograph Stone Carving
- Making a Pictograph
- Math Lessons Pictograph
- Math Pictographs
- Template of Pictograph


