Curated OER
The Numbers Tell the Story
Students demonstrate how to gather and interpret statistical data. For this data analysis lesson, students search for statistics on the health effects of smoking and place the information into charts. Students create these charts online...
Curated OER
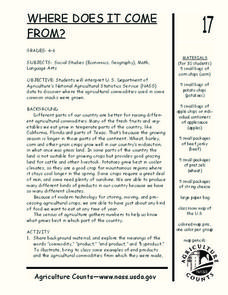
Where Does It Come from?
Learners read articles about various agricultural products and create a map using the statistics in the article. In this agricultural statistics lesson, students look at the geography of the country and which products come from the...
Curated OER
Energy Audit
Young scholars collect data about energy usage and use mathematical calculations to analyze their data. In this energy conservation and statistics math lesson, students survey their homes to complete an energy usage worksheet. Young...
Curated OER
All About Graphs
Students practice organizing data by creating graphs. For this statistics lesson, students survey the class about favorite colors and create a bar graph using the data. Students complete a test based on pet and animal statistics.
Curated OER
Making a Colorado Brochure
Students create brochures reflecting the state of Colorado. In groups, they write about tourist attractions, important people, major cities, and statistical information. After writing, they create their brochure importing clip art and...
Curated OER
Graphically Speaking
Students discover the links between population and Congressional representation. In this government lesson, students research population statistics and create spreadsheets that compare population to the number of Congress members per state.
Curated OER
Populations and Life Cycles
Students explore biology by researching ocean statistics. In this data analysis lesson, students conduct a snail examination experiment utilizing live pouch snails. Students collect data about the snails over the course of six weeks and...
Curated OER
Designing Detectives
Third graders explore the idea of formulating a hypothesis and designing an experiment to test the hypothesis.
Curated OER
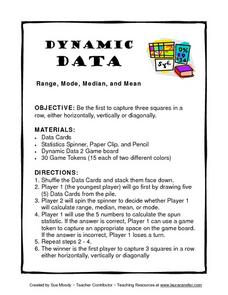
Dynamic Data Range, Mode, Median, and Mean
For this lesson, Dynamic Data Range, Mode, Median, and Mean, young scholars play a game while figuring range, mode, median, and mean. Students spin for their task, figure the mode, mean, median or range of a row of numbers and gain a...
Curated OER
Snack Attack
Learners design charts, tables, graphs, and pictographs to analyse the types of snacks in a bag.
Curated OER
Probability Using M&M's
Students estimate and then count the number of each color of M&M's in their bag. In this mathematics lesson, students find the experimental probability of selecting each color from the bag. Students create pictographs and bar graphs...
Curated OER
Data Analysis Using Technology
Analyze data using technology. Middle schoolers design data investigations, describe data, and draw their own conclusions. Then they select the best type of graph, graph and interpret the data, and look for patterns in trends. They also...
Curated OER
Excel, Word, and Basketball
Wow, this lesson packs a punch. Pupils interview basketball players, write about a game, and use Excel to organize statistics related to the players and the points scored. Afterward, they create posters, presentations, and much more.
Curated OER
Making a Cartogram
Students interpret statistical geographic information by creating a cartogram.
Curated OER
If the World Were a Village...
Your class members explore concept that the world is a large place, examine how statistics can be used to help in understanding the world and its people, and create illustrations or graphs of statistics found in the award-winning...
Education World
Putting Turkey on a Table (or a Graph)
Grateful learners put turkey on a table (or a graph)! Through a creative project they show statistical information about turkey population, production, and consumption. A great Thanksgiving lesson that can be applied at any time to the...
Curated OER
Winter Olympics History Year by Year
Investigate the history of the Winter Olympic Games. After researching this event and compiling necessary statistics, pupils use a graphic organizer to chart their findings. A template for a chart is included in this resource. Have your...
Curated OER
Linguistic Diversity. Languages in Canada - Elementary
Create a language mosaic to reveal the linguistic diversity in your community. Pupils interview a person with a home language other than English and contribute to a bulletin board display representing the variety of languages spoken. The...
Curated OER
How Big is Big?
Geography learners compare and contrast population densities throughout the world. Using maps, they estimate the relative size of the world's regions and populations. They develop analogies to discover the world they live in and...
Curated OER
Drug and Alcohol Awareness
Fourth graders examine the statistics when it comes to teens and drug and alcohol abuse. In groups, they research the side effects of four different drugs. Using the information, they perform a skit, or puppet show to share their data...
Curated OER
Graphing Statistics & Opinions About Pets
Young scholars explore how to use a double bar graph by polling other students about their feelings and experiences with pets. They also have the opportunity to think about how pets affect their lives. Young scholars poll their...
Curated OER
Functions and Statistics: International Space Station: Up to Us
Students explore how the International Space Station was built and how it provides first-hand experiences with the space program. They view the NASA engineers discussing the major components of the International Space Station, their...
University of Arizona
Skittles & M&Ms Probability Experiment
Students are introduced to the scientific method by hypothesizing, counting, analyzing and concluding which company packs candy more reliably - Skittles or M&Ms.
Curated OER
Cyber Chow Combos
Learners, after watching the CYBERCHASE episode, "A Day at the Spa,"represent and count combinations of choices using tree diagrams.
Other popular searches
- Data, Census, & Statistics
- Probability and Statistics
- Educational Statistics
- Baseball Statistics
- Math Statistics
- Climate Statistics
- Math Lessons Statistics
- Median and Mean Statistics
- Statistics Lesson Plans
- Sports and Statistics
- Probability Statistics
- Black Plague Statistics


