Curated OER
Read a Picture Graph
It's the Bears vs. the Seals! Who is the season winner? Read this data and have your math class answer the six questions that follow. Consider graphing the chart as a class, or encouraging individuals to graph it before answering the...
Curated OER
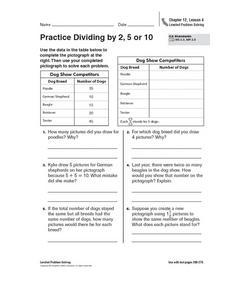
Practice Dividing by 2, 5, or 10
In this pictograph problem solving worksheet, students analyze the data on a table and create a pictograph. Students read and solve 6 story problems about the pictograph.
Curated OER
Special Ed. Resource
Ways to organize data is the focus of this math PowerPoint. Students view slides that define and give descriptions of a variety of graphs, and how mean, median, and mode are found. A good visual tool which should benefit almost all types...
Curated OER
Survey Says...
Young learners create and implement a school-wide survey about student body favorites! Learners record and analyze the data on a bar graph, picture graph, and line graph, and then display the data. Then, wrap it all up with a celebration...
Curated OER
Snack Attack
Students design charts, tables, graphs, and pictographs to analyse the types of snacks in a bag.
Curated OER
Color Tile Graphing
Learners explore data. They gather data and generate questions about the data in pictographs, tallies, tables, and bar graphs. Students use color tiles pulled by random to create their own bar graph. They discuss the bar graphs they...
Curated OER
Ice Cream Pictograph
Students create a graph. In this pictograph lesson, students cut out 20 small ice cream cones and decorate them. Students create a pictograph with their ice cream cones.
Curated OER
Getting There
Students practice reading a pictograph. In this data analysis lesson, students collect data and create their own pictograph. A students worksheet is included.
Curated OER
Math--Pictures and Bars--Learning About Graphs
What is a graph? What does it tell us? How do you make one? These are all questions that are answered in the included packet. It's a great introduction to graphing for young learners!
Curated OER
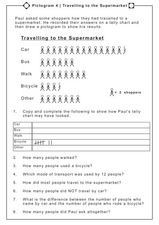
Pictogram 4: Traveling to the Supermarket
In this creating and comprehending a tally chart worksheet, students use a pictograph to tally the number of ways people traveled to the supermarket, tally the results, and answer comprehensive questions. Students answer 8 questions.
Curated OER
Bird Pictogram Page 2
In this math worksheet, students examine a pictogram which shows the 4 most common foods of wild birds. Students analyze the pictogram and answer 8 questions about the data displayed.
Curated OER
Usage and Interpretation of Graphs
Young scholars explore graphing. In this graphing lesson, students predict how many shoe eyelets are present in the classroom. Young scholars count eyelets and work in groups to organize and chart the data collected. Students put all the...
American Statistical Association
The Taste of Yellow
Does lemonade taste better when yellow? A tasty experiment has scholars determine the answer to the question. It requires conducting a taste test with lemonades of different colors (from food coloring), and then collecting and analyzing...
Curated OER
Picturing Hats
In this pictographs worksheet, students examine a pictograph then solve 11 problems related to the data in the pictograph. Students cross out problems that do not relate to the pictograph.
Discovery Education
Mood Music!
Grouchy? Sad? Here's a great resource that shows kids how music can be used to lift their spirits. Kids collect and chart data on the effects of music on emotions. After analyzing the results of their experiment, they develop...
Curated OER
Favorite Candy Bar Graph
Students decide on six different types of candy bars to include in a data collection activity. Working in small groups, they survey a target group in a set amount of time. They access a Internet based graphing tool to create a bar graph...
Curated OER
Creating a Graph
Students brainstorm favorite things to do during the summer. They survey classmates to collect data, arrange it in a chart, and create graphs using ClarisWorks.
Curated OER
Download and Analyze
Students download information from a NASA website into a database. They transfer it to a spreadsheet by completing the information and analyze the information. They determine temperature averages, mode, and graph the results. They write...
Curated OER
Lucky Charms Pictograph
Third graders create pictographs using a breakfast cereal. This fun, hands-on lesson plan allows students to use Lucky Charms cereal to create a pictograph. When the lesson plan is through, 3rd graders get to eat their Lucky Charms...
Fuel the Brain
Egg Hunt Pictograph
If you did a hypothetical egg hunt in class, wouldn't it be great to see how many eggs were collected? Your youngsters will receive a list of "collected data" and create a pictograph.
Curated OER
Moo-Velous Butter!
Third graders investigate how temperature and motion (energy) create a chemical change that turns cream ( a liquid) into butter (a solid). They create a class pictograph of their favorite mils choices (white, chocolate, or strawberry)...
Curated OER
Pictograms: Animals in the Zoo
In this math worksheet, students examine a pictogram which shows data about how many of 5 species of animals live in the zoo. Students answer 7 word problems about the pictogram.
Curated OER
Word Search Y3 Data
In this word search worksheet, learners find the words in the word search and then circle them. There are 16 words in the word bank for students to locate. They then try to find any other words that they can. The answers are on the...
Curated OER
Pictograph Activity
In this pictograph worksheet, students learn to read a pictograph and answer questions based on the data. Students then draw two of their own pictographs using the given information and answer questions based on graphs.


