Agriculture in the Classroom
Roll of the Genes
Animal reproduction in sheep and cattle is explored with the help of Punnet squares. Scholars employ tools using probability to conclude the color of wool a sheep's offspring will have. Acting as animal geneticists, pupils then take...
Alberta Learning
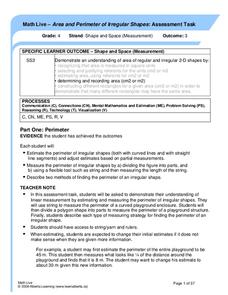
Area and Perimeter of Irregular Shapes
Evaluate young mathematicians' understanding of area and perimeter with this series of three assessment tasks. Challenging students to not only calculate the area and perimeter of irregular shapes, but to explain in writing their...
Curated OER
How to Implement Project Based Learning to Engage Students
Can a math teacher employ project-based learning? Learn how one great math teacher uses PBL to design math projects that provide learners with a more challenging and holistic learning experience. A wonderful article, that includes...
Curated OER
Improving Students' Math Proficiency
We can help our students improve math proficiency by using a cross-curricular approach and multiple problem-solving techniques.
Curated OER
Basic Excel
Students explore basic Excel spreadsheets. In this spreadsheet lesson plan, students enter Alaska weather information and perform calculations. Students title the columns on the spreadsheet and format the cells. ...
Curated OER
N is for Natural State
For any pupils who live in the state of Arkansas, this would be a fabulous educational experience to help them get to know their state better. Through the use of activities in literature, art, mathematics, science, social studies, and...
Curated OER
Food for Spaceflight
When astronauts get hungry in outer space, they can't just call and have a pizza delivered. In order to gain an appreciation for the challenges associated with space travel, young learners are given the task of selecting,...
Institute of Electrical and Electronics Engineers
Exploring at the Nanoscale
Nano-nano! Nanotechnology can seem like it's from another planet! After learning about this tiny technology, collaborative groups experiment with how smaller particles affect chemical reactions. They do this by immersing a whole and a...
Curated OER
Mmm, Mmm, M&M's
Here is another version of the classic M&M math lesson. In this one, upper graders utilize the ClarisWorks Spreadsheet program in order to document the data they come up with from their bags of M&M's. After making their initial...
Curated OER
Just a Minute!
Students put the standard measure of clock time -- the minute -- in perspective. This lesson can be modified for virtually any grade level. They write about what they learned about a minute as a result of the activities.
Education World
Teaching Students to Tell Time: Three Resources for Busy Teachers
Elementary schoolers develop time-telling skills, one skill at a time. They examine the connection between time on digital and analog (clock-face) clocks. An excellent lesson on teaching how to tell time!
Curated OER
ZIP Code Math
Students add or subtract to solve ZIP Code Math word problems. A ZIP Code Math work sheet is included. This lesson combines math with geography quite nicely.
Curated OER
Math and Architecture Lesson
Students examine relationship between architecture and math, explore importance of inventions to humanity and relate math and architecture to their school and home by creating graphs, tables, and presentations showing development of...
Curated OER
Learning Math with Music
Students work in groups to create their own rhymes and songs for an entire family of math facts. They record their math facts creations using an iPod and a voice recorder for future use.
Curated OER
Ramp Builder
Young scholars plan and build a ramp designed for maximum distance a car can travel. In this physics and data collection math lesson, students work in groups to design a ramp using various household materials. Young scholars test small...
SMART Project
Shop with Us at Whelan School
Third graders use their math and research skills to create and manage a classroom/school store. They use a computer to manage, organize and access information. They practice pricing products, computing sales, counting money and...
Curated OER
Motherhood Math: Mothers in the Workforce
Students evaluate a table showing how the number of working mothers increased between 1955 and 2000. They use the information from the table to complete a worksheet imbedded in this lesson plan.
Curated OER
Charting History With Pennies
Students collect pennies and sort them in ascending order of dates. For the year on each penny, students research key events in history and pick a single event, explaining its historical significance. Then students use these events to...
Curated OER
Math All Around Us!
Students walk around their neighborhood and school to find objects that remind them of a math concept or vocabulary term. In this real world math lesson, students find math concepts in various familiar locations and take pictures of...
Curated OER
Geography Made Fun with Technology
Students incorporate knowledge box into their classroom activities. In this technology integration lesson, students fill out a graphic organizer using Glossopedia to analyze a new subject.
Curated OER
What Do You SUBpose?
Submarines are the fous of this math and science lesson. In it, learners explore the world of submarines: how they work, and what they are used for. They engage in hands-on activities, watch video clips, and work in cooperative groups in...
Curated OER
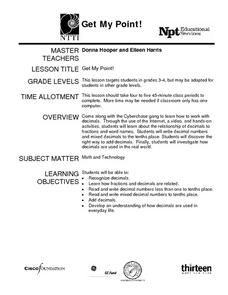
Get My Point!
Here is one of the better lessons I've come across on how to teach fractions and decimals. This instructional activity does a great job of showing how these two mathematical representations of numbers are interrelated. Some excellent...
Agriculture in the Classroom
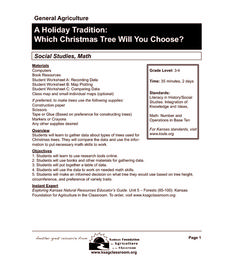
A Holiday Tradition: Which Christmas Tree Will You Choose?
Different varieties of Christmas trees provide an interesting way to combine social studies, science, math, and technology. Class members not only research the history of the Christmas tree holiday tradition, they compare and...
Curated OER
Create a Graph Online
Scholars create colorful bar, line, or pie graphs. They decide on a survey question to ask or a type of data to gather. From there, they collect information and data. They display this data in bar, line, or pie graphs that they create...

