Curated OER
M&M Graphing and Probability
Students create a variety of graphs. They count, sort, and classify M&M's by color and record data on a chart. They use data from the chart to create pictographs, bar graphs and circle graphs. They analyze data and determine...
Curated OER
Favorite Book Graph
In this favorite book graph worksheet, students record each book that they've read during the year and create a graph on which books they liked the best.
Curated OER
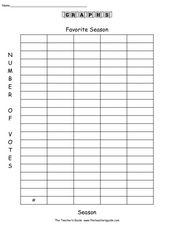
Favorite Season
In this graphing worksheet, students conduct a survey of people's favorite survey. They then complete 8 questions about the data gathered before creating a bar graph and pictograph on templates.
Curated OER
Slanted Surveys And Statistics
Learners engage in a lesson that is concerned with the use of statistics and surveys and how they should be read. They create a survey and take it home to collect data. Then students display the data on a graph that is displayed in class.
Curated OER
Food chains at sea
Fifth graders interpret a table of data about food chains in the ocean. They create a food chain to represent the information on the table. Periwinkles eat seaweed, and crabs eat periwinkles - so who eats crabs? Extend the activity with...
American Statistical Association
Speedster
Catch me if you can. Scholars collect data on reaction time by catching a falling ruler or by using an Internet app. They determine the median of the data, create graphs, and analyze the results. They also compare their data to the rest...
Curated OER
Tracking Fall's Falling Temperatures
Young meteorologists track weather from day to day and record results on graphs, maps, or other places. They see firsthand how weather temperatures trend cooler as fall progresses and practice grade-appropriate skills in geography (map...
Curated OER
The Life Cycle of the Mealworm
Fourth graders provide a habitat for live mealworms and observe their life cycle. In this animal life cycle and scientific inquiry instructional activity, 4th graders create a habitat for a live mealworm and observe and record related...
Curated OER
And You Thought Gasoline Was Expensive!
Young scholars carry out a cost analysis. In this comparative math activity, students compare the cost of equal measures of gasoline to mouthwash, house paint, fruit juice, white-out, and other liquids.
Curated OER
The Ups and Downs of don Pasquale: Mapping the Emotional Journey of Characters in Don Pasquale
Students listen to and retell the story of Don Pasquale. They evaluate the emotions of the main characters. Students create a graph of the emotions of Don Pasquale.
Curated OER
"who Lives in Your House?"
Fourth graders collect data about the people and animals living in their homes, and the students' shoe sizes. They work in groups to enter the information into a database from which they create graphs. They analyze the data to find the...
Curated OER
Coordinates and Perimeters
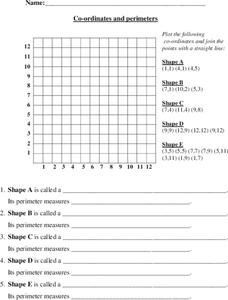
Here is a lesson containing a great activity based on coordinates, and the perimeters of shapes created using a given set of coordinates. After youngsters creat a shape on a grid based on some coordinate pairs, they must identify which...
Curated OER
Tree Measurement
Measure a tree? Yes, measure a tree! Students get outside and measure a tree's trunk, crown, and height. Each group compares their answers to determine if any re-measuring is necessary. Once back in the classroom, students make bar...
Curated OER
Circle Graph Activity
For this circle graph worksheet, students ask 16 people what their favorite vegetable are, then create a circle graph to represent the information.
Curated OER
M & Ms in a Bag
Young scholars make predictions about the number and colors of M&M's in a snack size package. They create an Excel spreadsheet to record the data from their small group's bag, create a graph of the data, and discuss the variations...
Curated OER
Skittles Lab
Students use Skittles as manipulatives to practice computing decimals from fractions, computing decimals into percentages, and creating bar graphs from gathered data.
Curated OER
Pumpkin Properties are a Smash!
Students receive a miniature pumpkin and proceed through several stations to measure a variety of physical properties. The data is entered into a data sheet and the mass and volume measurements are used to calculate density. They also...
Curated OER
Apple Graphing
Learners sample a variety of types of apples and then survey each other regarding their favorites. They chart how many students prefer each type of apple.
Curated OER
Amazing Bean Races
Learners experiment with bean growth in varied conditions. In this plant biology lesson plan, students plant beans in soil and in spun cellulose (absorbent material in diapers) and measure the growth of their seedlings. They...
Curated OER
Environmental Graphing
Pupils experiment with graphing. In this graphing introduction lesson, students complete four activities: 1) a bar graph based on class birthdays 2) an estimation graph of the raisins in raisin bread 3) another estimation example with...
Curated OER
Introduction to Bar Graphs Lesson Plan
Students organize and interpret data using bar graphs.
Curated OER
Making Patterns - Create, Analyze, and Predict
Fourth graders practice making patterns using Unifix cubes and identify, analyze, and determine rules for describing numerical patterns involving operations and nonnumerical growing patterns. They also find an example of a pattern in...
Curated OER
Get Your Pupils Moving While Learning
Use these teaching strategies to get the wiggles out and keep the learning in!
Curated OER
Measuring Mixed Numbers
Mixed numbers can be added conceptually, algorithmically, and physically. Have the class visualize mixed numbers by adding fraction bars together. They then discover the algorithmic process that simplifies adding mixed numbers. Finally,...


