PBS
Insulation Station
It's all about the material. Learners experiment with different substances as they try to keep an ice cube from melting. They draw conclusions by answering a set of questions about the types and amount of material that had the best result.
NASA
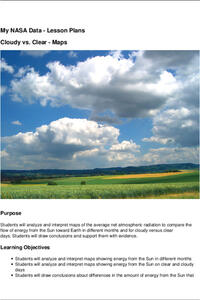
Cloudy vs. Clear - Maps
Find out the science of how clouds keep Earth cooler on hot days. Using guided discussions, investigators analyze and interpret maps of how much solar energy Earth receives at different times of the year. Participants draw conclusions...
Curated OER
Misleading Graphs
Students explore number relationships by participating in a data collection activity. In this statistics lesson, students participate in a role-play activitiy in which they own a scrap material storefront that must replenish its stock....
Curated OER
Local Traffic Survey
Students conduct a traffic survey and interpret their data and use graphs and charts to display their results.
Center for Learning in Action
Investigating Physical and Chemical Changes
Super scientists visit ten stations to predict, observe, and draw conclusions about the physical and chemical changes that occur when different states of matter—liquid, solid, and gas—are placed under a variety of conditions. To...
Curated OER
Dealing with Data in Elementary School
Students follow the scientific method in collecting data. In this following the scientific method in collecting data lesson, students develop a question they would like answered such as how many aluminum cans are consumed each school...
Curated OER
Estimation and Your TV Diet
Students develop estimation skills by using real life situations. In this estimation lesson students collect data about their television watching habits. They make hypothesis about the number of hours they watch, how many commercials,...
Curated OER
Arthropod Data Collection
Young scholars describe the life cycle of various bugs as well as their predators and feeding habits. The class participates in a discussion of the various methods scientists use to gather data including research and experiment. After...
Curated OER
Charting and Graphing Sales
Students analyze graphs, charts and tables. In this data analysis instructional activity, students practice creating and analyzing charts, graphs and tables corresponding to sales and surveys. This instructional activity uses data...
Curated OER
Spinner Experiment
Students collect and analyze data, then draw conclusions from the data and apply basic concepts of probability.
Cornell Lab of Ornithology
Investigating Evidence
Explore the scientific process through nature. Scholars become scientists as they develop a question, design an experiment, collect data, and analyze their results. A two-week lesson guides your classes through the process and provides...
Curated OER
Human Effect
Students investigate changes in air quality. In this science lesson, students compare data to determine the air quality. Students explore how humans affect the air quality.
Curated OER
McCadam's Quarterly Report
Fourth graders problem solve a problem from a local business using data, generating graphs, and draw conclusions. They submit their findings in a business letter format with feed back from a company's plant manager.
Curated OER
A Closer look at Oil and Energy Consumption
Upper graders analyze basic concepts about the consumption, importation and exportation of the worlds oil production. They create several graphs to organize the data and draw conclusions about the overall use of oil in the world.
Baylor College
Body Mass Index (BMI)
How do you calculate your Body Mass Index, and why is this information a valuable indicator of health? Class members discover not only what BMI is and practice calculating it using the height and weight of six fictitious individuals, but...
Space Awareness
Continental Climate and Oceanic Climate
There's nothing better than a cool breeze blowing in from the ocean. Scholars explore how water affects change in temperature using a hands-on experiment on climate. They use measurement tools to compare the continental and oceanic...
Curated OER
Circles Minilab
Students learn how to measure the diameter and circumference of a circle. In this circle lesson, students organize their data to create a graph. Students utilize their graph to make an inference about the slope of pi.
Purdue University
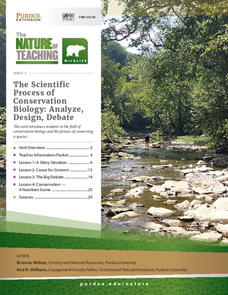
The Scientific Process of Conservation Biology: Analyze, Design, Debate
Scientists use data to learn about species survival—and your classes can too! A set of four lessons guides learners through a process to draw conclusions about the fluctuations in the population of the Hellbender species. They read...
Curated OER
How Alike Are We?
Fourth graders find the range, mode, median, and mean for each of the data sets (height and shoe size). They discuss which measure of central tendency for each data set best represents the class and why. Students graph the shoe size and...
Curated OER
Which Fish Where?
Here is a lesson outline that prompts elementary students to graph and analyze data regarding fish caught along the Hudson River. They will review vocabulary and complete 2 worksheets which can be accessed by clicking on the provided links.
Curated OER
Mathematics of Fair Games
Students examine mathematicians' notion of fairness in games of chance. They work in pairs to perform three different experiments using macaroni and paper bags. They record their results on charts and compare their data.
Curated OER
Simple Machines
Fourth graders investigate and explore the inner workings of objects that help us do work. They examine how the parts work together to make the object function. Using the internet, 4th graders discover the interaction of the parts of a...
Curated OER
Greenhouse Effect ...Building Our Own
Students explore the greenhouse effect. They set up a simplified model of the earth and the greenhouse effect. Students compare temperatures inside a jar to temperatures outside the jar. Pupils collect information and create a line...
Curated OER
Buoyant Boats
Fourth graders explore the concept of mass and buoyancy. After building boats out of several materials, they predict whether each boat floats if certain objects are added. Students test their predictions and draw conclusions from their...


