EngageNY
Comparing Data Distributions
Box in the similarities and differences. The 19th lesson in a unit of 22 presents class members with multiple box plots to compare. Learners use their understanding of five-number summaries and box plots to find similarities and...
EngageNY
Connecting Graphical Representations and Numerical Summaries
Which graph belongs to which summary statistics? Class members build upon their knowledge of data displays and numerical summaries to connect the two. Pupils make connections between different graphical displays of the same data in the...
EngageNY
Developing a Statistical Project
The 17th lesson plan in a unit of 22 presents asks the class to conduct a statistics project. Pupils review the first two steps of the process of asking a question and collecting data. They then begin the process by developing a...
EngageNY
Understanding Box Plots
Scholars apply the concepts of box plots and dot plots to summarize and describe data distributions. They use the data displays to compare sets of data and determine numerical summaries.
EngageNY
More Practice with Box Plots
Don't just think outside of the box — read outside of it! The 15th lesson in a 22-part unit provides pupils more work with box plots. Learners read the box plots to estimate the five-number summary and interpret it within the context....
EngageNY
Describing Variability Using the Interquartile Range (IQR)
The 13th instructional activity in a unit of 22 introduces the concept of the interquartile range (IQR). Class members learn to determine the interquartile range, interpret within the context of the data, and finish by finding the IQR...
EngageNY
Describing Distributions Using the Mean and MAD II
The 11th lesson in the series of 22 is similar to the preceding lesson, but requires scholars to compare distributions using the mean and mean absolute deviation. Pupils use the information to make a determination on which data set is...
EngageNY
Describing Distributions Using the Mean and MAD
What city has the most consistent temperatures? Pupils use the mean and mean absolute deviation to describe various data sets including the average temperature in several cities. The 10th lesson in the 22-part series asks learners to...
EngageNY
Variability in a Data Distribution
Scholars investigate the spread of associated data sets by comparing the data sets to determine which has a greater variability. Individuals then interpret the mean as the typical value based upon the variability.
EngageNY
The Mean as a Balance Point
It's a balancing act! Pupils balance pennies on a ruler to create a physical representation of a dot plot. The scholars then find the distances of the data points from the balance point, the mean.
EngageNY
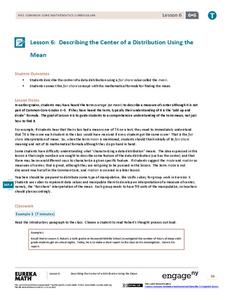
Describing the Center of a Distribution Using the Mean
Everyone does their fair share. The sixth segment in a 22-part unit presents the mean as a fair share. Groups build a conceptual understanding of the mean of a data set, rather than simply learn an algorithm. Learners use the...
EngageNY
Describing a Distribution Displayed in a Histogram
The shape of the histogram is also relative. Learners calculate relative frequencies from frequency tables and create relative frequency histograms. The scholars compare the histograms made from frequencies to those made from relative...
EngageNY
Creating a Histogram
Display data over a larger interval. The fourth segment in a 22-part unit introduces histograms and plotting data within intervals to the class. Pupils create frequency tables with predefined intervals to build histograms. They describe...
EngageNY
Creating a Dot Plot
Which dot am I? Pupils create dot plots to represent sample data through the use of frequency tables. The third segment in a series of 22 asks individuals to analyze the dot plots they created. The scholars translate back and forth...
EngageNY
Displaying a Data Distribution
Pupils analyze a display of data and review dot plots to make general observations about the highest, lowest, common, and the center of the data. To finish, learners match dot plots to scenarios.
EngageNY
Posing Statistical Questions
Is this a statistical question? The opening lesson in a series of 22 introduces the concept of statistical questions. Class members discuss different questions and determine whether they are statistical or not, then they sort the data...
Funbrain
Math Baseball
Hey batter, batter, swing! Reinforce math concepts with a baseball-themed interactive. Scholars add, subtract, multiply, and divide numbers with an interactive math resource. Custom-tailored to their proficiency level, the activity is...
CK-12 Foundation
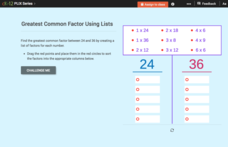
Greatest Common Factor Using Lists
By creating a list of factors for two numbers, it is easier to see the greatest common factor. Each question in an interactive resource asks pupils to identify the greatest common factor for the numbers 24 and 36 in several different...
CK-12 Foundation
Whole Number Multiplication: Multiplication Map
How many miles did a car travel if it traveled at 55mph for three hours? What are the factors for this multiplication sentence? These are the questions young mathematicians must solve using a multiplication map.
CK-12 Foundation
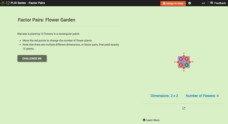
Factor Pairs: Flower Garden
Arrange the dimensions of Marissa's rectangular flower garden so that 12 flowers can be grown. How many factor pairs does the number 12 have? What dimensions are necessary for a square shaped planter?
CK-12 Foundation
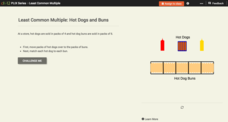
Least Common Multiple: Hot Dogs and Buns
Find the least common multiple of hotdog packages and bun packages in an interactive that allows pupils to drag and drop a set of four hot dogs into a pack of six buns to find the least common multiple of the sets.
CK-12 Foundation
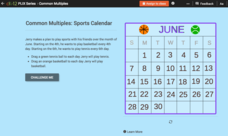
Common Multiples: Sports Calendar
Using a calendar, basketballs, and tennis balls, young mathematicians determine the common multiples of four and six. Individuals drag and drop the balls onto the correct dates each sport will be played, allowing them to see which days...
CK-12 Foundation
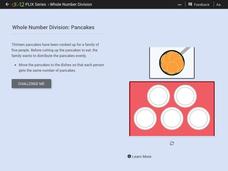
Whole Number Division: Pancakes
Given 13 pancakes and five plates, learners are asked to distribute the pancakes evenly among the plates. Is it possible? Will there be any remainders? These are the questions pupils are asked to answer after manipulating an interactive...
CK-12 Foundation
Sums of Integers with Different Signs: Board Game
Five questions challenge scholars to show what they know about integers. Using an interactive board game, learners move pieces to discover where a player landed, then answer problems involving both positive and negative integers.


