Curated OER
Mean, Median, & Mode
Pupils determine mean, median, and mode. In this problem solving lesson, students evaluate a set of data to determine the mean, median, and mode. Pupils work in small groups practicing cooperative learning skills as they problem solve.
Curated OER
Perimeter
Fifth graders create math word problems. In this geometry lesson, 5th graders define perimeter and discover how to find the perimeter of a rectangle, a square and a regular polygon. Students write word problems on finding the...
Curated OER
Space Circles
Fifth graders calculate the diameters and radius of planets as a book is read to them. In this diameter and radius lesson plan, 5th graders read the book Space Circles and calculate the measurements based on the information in this book.
Shodor Education Foundation
An Introduction To Quadrilaterals
Young geometers investigate and apply properties of quadrilaterals. After a review and discussion of key terms, young scholars use a computer applet to explore four-sided figures and classify them according to their attributes. The...
Curated OER
Hey! What Is Your Angle?
Fifth graders create and classify straight, right, acute and obtuse angles. In this clever lesson, 5th graders utilize pretzel sticks to form different types of angles. Best of all, they get to eat them at the end!
Curated OER
By The Pound
Students develop mathematical skills using measurement in the form of weight. They also perform calculations to find cost and strengthen estimation skills while comparing the actual price. The context for the lesson is in the industry of...
Curated OER
Scientist Are Like Detectives
Students demonstrate proper scientific observation skills. In this investigative science lesson, students make observations, record their findings and form conclusions in order to improve their scientific documentation and writing skills.
Curated OER
Cuisenaire Fractions
Young scholars study fractions by comparing rations using Cuisenaire rods. They make predictions, measure lengths using Cuisenaire rods and explain their answers. Next, they discuss the relationship of the different rods in terms of...
Curated OER
Don’t Sit Under the Apple Tree…You Might Become Famous
Students explore Newton's laws using CEENBoTs. In this physics lesson plan, students collect data and create tables and graphs. They calculate speed, acceleration and forces using mathematical formulas.
Curated OER
Modular Arithmetic
Students investigate modular arithmetic and how to use it to solve real world problems. In this modular arithmetic lesson, students use computers to work on modular arithmetic after a teacher guided lesson. They complete guided practice...
Curated OER
Longitude
In this globe worksheet, students learn how longitude is measured on a globe. Students read the information before answering 5 questions. A globe will be required.
Alberta Learning
Area and Perimeter of Irregular Shapes
Evaluate young mathematicians' understanding of area and perimeter with this series of three assessment tasks. Challenging students to not only calculate the area and perimeter of irregular shapes, but to explain in writing their...
Curated OER
Ag In The Outfield
Young scholars explore baseball. This is a cross-curricular plan that includes math, history, and agriculture. Pupils use their five senses to observe the materials a baseball is made from and identify the agricultural products used. In...
Curated OER
Triangle Wars
Learners explore geometry by participating in a class card game. In this triangle instructional activity, students utilize playing cards with shapes on them which they group up and discard, similar to "Old Maid." Learners complete a...
Curated OER
Mr. Goldman's Good Idea
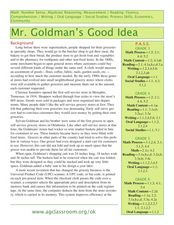
Shopping carts are a modern convenience that many people take for granted. Make sure your pupils do not fall into that category by completing the activities in this plan. There are ideas included for language arts, social studies, math,...
Chicago Botanic Garden
Climate Change Around the World
Look at climate change around the world using graphical representations and a hands-on learning simulation specified to particular cities around the world. Using an interactive website, young scientists follow the provided...
Curated OER
Estimation
Students complete computer activities about estimating if items are more or less than a given amount. In this estimation lesson plan, students also estimate measurements around the classroom.
Curated OER
How to Calculate Time
Students complete a worksheet. In this calculations lesson, students learn factual information about computing time with clocks, calendars and eras. Students show their knowledge by completing a worksheet.
Curated OER
Critter Encounter Chart
Students record data found at an assigned web site. For this data collection lesson, students access an assigned web site in order to complete a data chart about animals they see. They travel to different sections of the web site to find...
Curated OER
Finding the Average Temperature
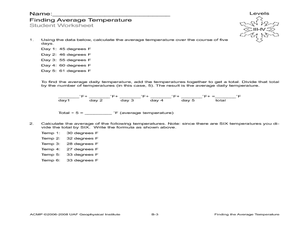
Students calculate averages. For this average temperature lesson, students collect data and use their problem solving skills to calculate average temperatures.
Curated OER
Altering a Plant Environment
Students investigate what a controlled group is by creating an experiment. In this plant growth lesson, students identify the different parts of a plant and discuss what is needed for a plant to be successfully grown....
Curated OER
Vegetable Creatures
Students use different foods to enhance academic skills in all area contents. In this food activity lesson, students use food, such as "bugs on a log" (raisins on peanut butter celery) to estimate and practice multiplication. ...
Shodor Education Foundation
Sets and the Venn Diagram (Beginner)
Venn diagrams are helpful in understanding the idea of a set and using attributes to sort items. This basic plan is an introduction with an added bonus of an applet that can be used to demonstrate the activity. If a classroom of...
Curated OER
Statistics: Misleading or Accurate?
Students explore the concept of misleading statistics. In this misleading statistics instructional activity, students play a game of tag and graph the number of times each student gets tagged. Students use the graph to determine the...


