Pace University
Grade 7 Earth Day Statistics with Circle and Bar Graphs
Take a tiered approach to studying waste. The lesson uses Earth Day to present differentiated instruction around using circle and bar graphs. Each group gets a cube based on their tiers and works collaboratively as well as individually...
Concord Consortium
People and Places
Graph growth in the US. Given population and area data for the United States for a period of 200 years, class members create graphs to interpret the growth over time. Graphs include population, area, population density, and population...
PHET
Plinko Probability
It's a good thing the resource dropped into your radar. Young mathematicians use an app that randomly drops balls through a Plinko game and into bins. They compare the distribution to that of an ideal binomial distribution.
PHET
Least-Squares Regression
Less is best when looking at residuals. Scholars use an interactive to informally fit a linear regression line to data on a scatter plot. The interactive provides a correct best fit line with residuals and correlation coefficient to...
CCSS Math Activities
Smarter Balanced Sample Items: 6th Grade Math – Target J
What is the best measure of central tendency? Scholars explore mean, median, mode, range, and interquartile range to understand the similarities and differences. They display data in dot plots, histograms, box plots, and more as part of...
CCSS Math Activities
Smarter Balanced Sample Items: 6th Grade Math – Target I
Scholars apply their knowledge of statistical questions to determine which questions meet the criteria. Grade 6 Claim 1 Item Slide Shows offers a couple of practice problems for scholars to discuss.
CCSS Math Activities
Smarter Balanced Sample Items: 7th Grade Math – Target H
Not one but two box plots. How will your pupils fare? Assess their understanding of box plots by having them compare two populations. The eighth of nine installments in the Gr. 7 Claim 1 Item Slide Shows series, the resource has them...
CCSS Math Activities
Smarter Balanced Sample Items: 7th Grade Math – Target I
The probability is high that these questions will challenge your pupils! The ninth and final installment of the Grade 7 Claim 1 Slideshow series, a set of items assesses the understanding of simple and compound probability concepts....
CCSS Math Activities
Smarter Balanced Sample Items: 7th Grade Math – Target G
Don't leave learning to chance! Assess your class's understanding of random sampling and making inferences using questions from the experts at Smarter Balanced. As the seventh of nine parts in the Gr. 7 Claim 1 Item Slide Shows series,...
Corbett Maths
Quantitative and Qualitative Data
Classify the Big Ben of all data with a video that defines quantitative and qualitative data. Given data about Big Ben, the presenter classifies each piece based upon the definitions. In the Types of Data worksheet, individuals show they...
Corbett Maths
Discrete and Continuous Data
Let's be discrete about the types of data. A short video provides the definitions of discrete and continuous data. After providing the definitions, the resource takes different types of data and sorts them based on type and provides an...
CCSS Math Activities
Smarter Balanced Sample Items: 8th Grade Math – Target J
Look at patterns in bivariate data. Eight sample items illustrate the eighth grade statistics and probability standards. The Smarter Balanced Sample multiple-choice items focus on numerical and categorical bivariate data. The slide show...
Creative Learning Exchange
Lesson Plans From The Lorax
When it comes to the environment, no variable is constant. Class members graph behavior over time for the thneeds produced over truffula trees chopped down over the course of Dr. Seuss's The Lorax.
Corbett Maths
Median for a Frequency Table
Try to find the middle of a frequency table. Using a frequency table of ages, the video shows how to use a formula to determine the position of the median. The resource uses frequency tables with both even and odd numbers of data points.
PBS
The Lowdown — Exploring Changing Obesity Rates through Ratios and Graphs
Math and medicine go hand-in-hand. After viewing several infographics on historical adult obesity rates, pupils consider how they have changed over time. They then use percentages to create a new graph and write a list of questions the...
PBS
The Lowdown — Examining California's Prison System: Real-World Ratio
Free yourself from the shackles of traditional math lessons. Young mathematicians investigate race, gender, and age differences in California's prison system. They use provided graphics to compare the prison population with the state's...
Corbett Maths
Medians and Quartiles from Grouped Frequency Tables and Histograms
Determine medians within a group. Given data represented as a frequency table of grouped data, the video demonstrates finding an estimation for the median. After finding the group where the median resides, the presenter uses a formula to...
Corbett Maths
The Median
Find the one in the middle. An informative resource explains how to determine the median of a set of numbers. Using both even and odd numbers of data points, the video covers the process of finding the middle number. Worksheets provide...
Corbett Maths
The Range
Spread the data out on the range. The short video provides a definition of the range. Using a data set of five numbers, the resource calculates the range.
Corbett Maths
The Mode
Most frequently prefer the mode. The resource defines the mode and shows how to determine it in a data set. Using another type of problem, the video develops a data set with a given mode and number of data points.
Corbett Maths
Listing Outcomes
Make a list and check it twice. Many times, it is beneficial to make a list of the possible outcomes when trying to determine a probability. The resource shows how to systematically make a list and then calculate the probability of...
Corbett Maths
Tree Diagrams
Climb out on a branch to find probabilities. Using tree diagrams, the resource shows how to find compound probabilities when the events are not uniform. The video works through two different scenarios, one where the probabilities remain...
Concord Consortium
Mystery Dice
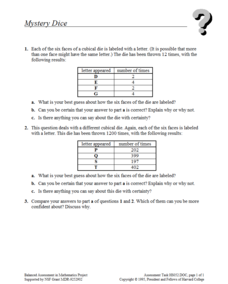
Dice aren't typically mysterious devices, but these dice are anything but typical. Scholars try to come up with dice that match given information on the relative frequency when they roll them a certain number of times. They must then...
Concord Consortium
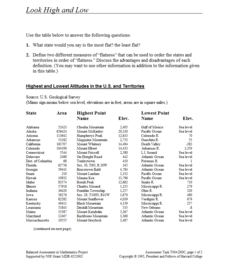
Look High and Low
From the highest high to the lowest low here's a resource that won't fall flat. Given data on the area and the highest and lowest elevations of each of the 50 states, learners decide which states are the least flat and the most flat. Of...


