EngageNY
One-Step Problems in the Real World
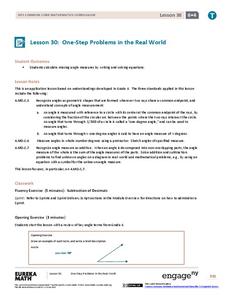
Mirror, mirror on the wall, which is the fairest resource of them all? Individuals write and solve one-step equations for problems about angle measurement, including those involving mirrors. Both mathematical and real-world problems are...
EngageNY
Describing Distributions Using the Mean and MAD
What city has the most consistent temperatures? Pupils use the mean and mean absolute deviation to describe various data sets including the average temperature in several cities. The 10th lesson in the 22-part series asks learners to...
EngageNY
Describing the Center of a Distribution Using the Median
Find the point that splits the data. The lesson presents to scholars the definition of the median through a teacher-led discussion. The pupils use data lists and dot plots to determine the median in sets with even and odd number of data...
EngageNY
Connecting Graphical Representations and Numerical Summaries
Which graph belongs to which summary statistics? Class members build upon their knowledge of data displays and numerical summaries to connect the two. Pupils make connections between different graphical displays of the same data in the...
EngageNY
Summarizing a Data Distribution by Describing Center, Variability, and Shape
Put those numbers to work by completing a statistical study! Pupils finish the last two steps in a statistical study by summarizing data with displays and numerical summaries. Individuals use the summaries to answer the statistical...
Noyce Foundation
Which is Bigger?
To take the longest path, go around—or was that go over? Class members measure scale drawings of a cylindrical vase to find the height and diameter. They calculate the actual height and circumference and determine which is larger.
Noyce Foundation
Rabbit Costumes
How many rabbit costumes can be made? This is the focus question of an activity that requires scholars to use multiplication and division of fractions to solve a real-world problem. They determine the amount of fabric necessary for eight...
Noyce Foundation
Percent Cards
Explore different representations of numbers. Scholars convert between fractions, decimals, and percents, and then use these conversions to plot the values on a horizontal number line.
Noyce Foundation
Cereal
Find the best protein-packed cereal. The short assessment task covers equivalent and comparing ratios within a context. Pupils determine the cereal with the highest ratio of protein. A rubric helps teachers with point allotments for...
Illustrative Mathematics
Making Cookies
Hooray for chocolate chip cookies! Ask your mathematicians to triple a chocolate chip cookie recipe and then reduce the recipe by one-fourth. Your class may need two days to complete, tripling the recipe the first day and reducing the...
Illustrative Mathematics
Running at a Constant Speed
The learner must use the given constant speed to find the unit rate. A table is made in order to relate the speed to the time and the distance. From the table, learners are able to see the unit rate in miles per minute and miles per...
Discovering Gifts In Middle School
Multiple Intelligences Checklist
Invite your pupils to discover their strengths with a multiple intelligences assessment. They read through several pages of activities and check off the items that apply. Learners then tally up their scores to determine which of the...
Noyce Foundation
Snail Pace
Slow and steady wins the race? In the assessment task, scholars calculate the rates at which different snails travel in order to find the fastest snail. Hopefully, your class will move much more quickly in finishing the task!
PBS
Working with Common Denominators: Assessments
Now that the practice is over, see if young mathematicians can utilize their new skills on finding common denominators and adding fractions. The assessment contains one map challenge and follows with skills practice.
Bowland
Olympic Cycling
Teach teenagers to think critically about data. Young data analysts must create two questions that can be answered using a provided data set on Olympic cycling times. Of course, they then have to answer their questions using mathematics.
Bowland
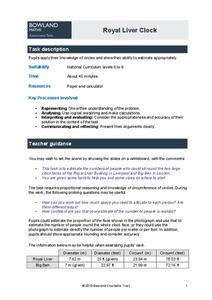
Royal Liver Clock
Using clocks as dining tables? Scholars estimate the number of people that can sit around the face of the clock on the Royal Liver Building in Liverpool. They use estimation to justify their responses.
Bowland
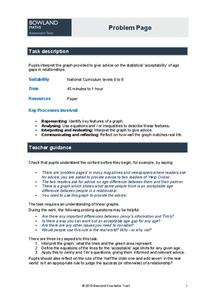
Problem Page
Future mathematicians use a given graph to answer a question about age differences in relationships. Along the way, they must find the equation and inequality of given graphs.
Illustrative Mathematics
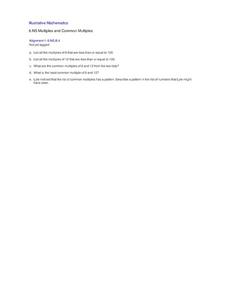
Multiples and Common Multiples
Learners are asked to find multiples and common multiples of two numbers. They must take their findings and find a pattern between the numbers and explain their reasoning. Use this resource with The Florist Shop activity in this series...
Illustrative Mathematics
Buying Gas
A quick problem to test your middle schoolers' knowledge of dividing with decimals. Also a good practice of unit rates, they must compute the cost of one gallon of gas when given the total amount for a fill up. Can be used as a preface...
Illustrative Mathematics
It's Warmer in Miami
Brrrr it's cold in Alaska! When given the temperatures of Anchorage and Miami in the winter, your mathematicians will calculate how much warmer it is in Miami. Answer key provides two different solution choices. Great as a warm-up for...
Illustrative Mathematics
Riding at a Constant Speed, Assessment Variation
Practice ratios and unit rates with tracking how long Lin took to ride her bike. Provided with different questions, your mathematicians can assemble their answers using a chart or setting up ratios. The activity is included in a set of...
Illustrative Mathematics
Molly's Run, Assessment Variation
Part of as assessment series, the activity follows the instructional activity Molly's Run to practice ratios and dividing with fractions. Different solution options are given for your learners' preference. The commentary explains how the...
Illustrative Mathematics
Painting a Barn
When painting a barn you have to calculate surface area, and that is exactly what this resource is about. Not only will your future home owners calculate the surface area, but also the cost. It is a real-life problem that every that...
Illustrative Mathematics
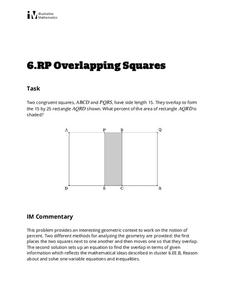
Overlapping Squares
The objective of this activity is to find the percent of the area of a two squares overlapping. Mathematicians find the ratio of area for the part that overlaps to the rectangle formed. The final answer is a percent as a rate per 100....
Other popular searches
- Grade 9 Applied Math
- Applied Math Weight
- Applied Math Blueprint
- Applied Math 20
- Worksheets Applied Math
- Applied Mathematics
- Applied Math Parallel
- Applied Math Electricity
- Applied Math Exam
- Applied Math for Aviation
- Applied Math Store
- Applied Math Conservation


