Illustrative Mathematics
Banana Bread
Show your future bakers how to choose the right baking pan by calculating the volume of a pan. The resource compares two pans, one with decimal edge lengths and is too small for the recipe and one that may work. Your number crunchers are...
Curated OER
End-of-Year Practice Test (Grade 6 ELA/Literacy)
With the end of the year quickly approaching it's time to find out exactly how much your sixth graders have learned. Specifically designed for the Common Core ELA standards, this practice test gives students five reading passages,...
Mathematics Assessment Project
25% Sale
Free clothes? In the middle school assessment task, learners first consider whether four 25 percent reductions will result in a sale price of $0. Mathematicians then determine the sale price and discount percentage of such a sale.
Illustrative Mathematics
Making Cookies
Hooray for chocolate chip cookies! Ask your mathematicians to triple a chocolate chip cookie recipe and then reduce the recipe by one-fourth. Your class may need two days to complete, tripling the recipe the first day and reducing the...
Illustrative Mathematics
Running at a Constant Speed
The learner must use the given constant speed to find the unit rate. A table is made in order to relate the speed to the time and the distance. From the table, learners are able to see the unit rate in miles per minute and miles per...
EngageNY
Describing the Center of a Distribution Using the Median
Find the point that splits the data. The lesson presents to scholars the definition of the median through a teacher-led discussion. The pupils use data lists and dot plots to determine the median in sets with even and odd number of data...
EngageNY
Least Common Multiple and Greatest Common Factor
Find the common denominator between prime factors, factor trees, and the distributive property. Scholars learn to find the least common multiple and greatest common factor of pairs of numbers. They rotate through stations to connect...
EngageNY
Divisibility Tests for 3 and 9
Who knew the sum of a number's digits gives such interesting information? The 18th installment of a 21-part module has scholars investigate division by three and nine. After looking at several examples, they develop divisibility tests...
EngageNY
Connecting Graphical Representations and Numerical Summaries
Which graph belongs to which summary statistics? Class members build upon their knowledge of data displays and numerical summaries to connect the two. Pupils make connections between different graphical displays of the same data in the...
EngageNY
Creating Division Stories
Create your own adventure story ... well, not really. The fifth instructional activity in a 21-part series has pairs create story contexts for division problems. The instructional activity presents a step-by-step process for pupils to...
EngageNY
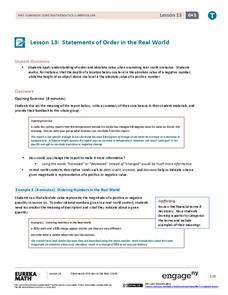
Statements of Order in the Real World
Positive and negative numbers are all around us. Groups read short story contexts and identify a rational number that represents the values in the context. They order the rational numbers and interpret statements of inequality.
EngageNY
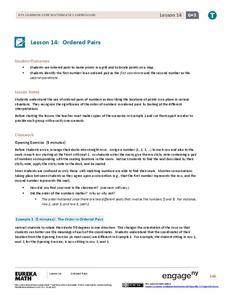
Ordered Pairs
Scholars learn to plot points on the coordinate plane. The lesson introduces the idea that the first coordinate of a coordinate pair represents the horizontal distance and the second coordinate represents the vertical distance.
EngageNY
Describing Distributions Using the Mean and MAD
What city has the most consistent temperatures? Pupils use the mean and mean absolute deviation to describe various data sets including the average temperature in several cities. The 10th lesson in the 22-part series asks learners to...
EngageNY
Summarizing a Data Distribution by Describing Center, Variability, and Shape
Put those numbers to work by completing a statistical study! Pupils finish the last two steps in a statistical study by summarizing data with displays and numerical summaries. Individuals use the summaries to answer the statistical...
Mathematics Assessment Project
Octagon Tile
A connecting-the-dots activity seems too easy for seventh grade but connecting vertices may prove a challenge. Class members first examine a figure created by drawing squares around the inside of an octagon and connecting the vertices....
Mathematics Assessment Project
Temperatures
As a middle school assessment task, learners first examine line graphs of monthly temperatures for two locations, and then match box plots to each line plot.
Curated OER
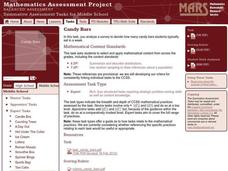
Candy Bars
There is often more to data than meets the eye. Scholars learn that they need to analyze data before making conclusions as they look at data that describes the number of candy bars boys and girls eat. They disprove a given conclusion and...
Noyce Foundation
Building Blocks
Building blocks have more uses than simply entertaining children. Young mathematicians calculate the volume of a given cube, and then calculate the volume and surface area of a prism formed from multiple cubes.
Noyce Foundation
Lawn Mowing
This is how long we mow the lawn together. The assessment requires the class to work with combining ratios and proportional reasoning. Pupils determine the unit rate of mowers and calculate the time required to mow a lawn if they work...
Noyce Foundation
Boxes
Teach your class to think outside the box. Scholars use the concept of equality to solve a problem in the assessment task. They determine how to use a scale to identify the one box out of a set of nine boxes that is heavier than the others.
Noyce Foundation
Parallelogram
Parallelograms are pairs of triangles all the way around. Pupils measure to determine the area and perimeter of a parallelogram. They then find the area of the tirangles formed by drawing a diagonal of the parallelogram and compare their...
Noyce Foundation
Ducklings
The class gets their mean and median all in a row with an assessment task that uses a population of ducklings to work with data displays and measures of central tendency. Pupils create a frequency chart and calculate the mean and median....
Illustrative Mathematics
Painting a Barn
When painting a barn you have to calculate surface area, and that is exactly what this resource is about. Not only will your future home owners calculate the surface area, but also the cost. It is a real-life problem that every that...
Noyce Foundation
Photographs
Scaling needs to be picture perfect. Pupils use proportional reasoning to find the missing dimension of a photo. Class members determine the sizes of paper needed for two configurations of pictures in the short assessment task.


