American Statistical Association
EllipSeeIt: Visualizing Strength and Direction of Correlation
Seeing is believing. Given several bivariate data sets, learners make scatter plots using the online SeeIt program to visualize the correlation. To get a more complete picture of the topic, they research their own data set and perform an...
Yummy Math
Should NFL Quarterbacks Shave or Grow a Beard?
What does facial hair have to do with quarterback ratings? Using a set of data that provides QBR with and without facial hair, football enthusiasts determine if performance is affected. It also has learners question if the relationship...
Curated OER
Handling Data: Representing Date - Online Version
Here is an online lesson plan on data representation. In it, learners access websites embedded in the plan which lead them through a variety of activities around data representation and statistics. The activities are quite good, and...
Curated OER
Data Analysis: Graphs, Charts, Tables, Statistics
In this data analysis worksheet, students interpret data in 5 problems involving graphs, tables, and scatterplots. Students construct 1 stem and leaf plot and find the mean, median, and mode of a data set.
Kenan Fellows
Let's Move
Find a statistical reason for a fresh start. Using a hypothetical scenario, individuals research statistical data of three different cities. Their goal? Find the best statistical reason for a business to move to a new location. Their...
Curated OER
Scattered About
Students are introduced to the concept of scatter plots after reviewing the various types of graphs. In groups, they analyze the type of information one can receive from a scatter plot and identify the relationship between the x and y...
Curated OER
Height versus Shoe Size
Students find a correlation between a person's height and his/her shoe size. They have access to entering data into lists on a graphing calculator and can complete scatter plots. Students read and interpret a scatter plot and use the...
Curated OER
Measuring Mania
Learners rotate through stations in the classroom, completing different types of measurements. These measurements are placed into a spreadsheet, and a scatter plot is generated. They type an explanation of their results in correlation...
Curated OER
Measuring "pHacts" about Acid Rain
Sixth graders gather and graph information regarding the pH of rain. Working cooperatively with an internet partner, 6th graders gather and record information about the pH of the rain in their local area. They graph this information...
University of Missouri
Money Math
Young mathematicians put their skills to the test in the real world during this four-lesson consumer math unit. Whether they are learning how compound interest can make them millionaires, calculating the cost of remodeling their bedroom,...
Teach Engineering
Efficiency of an Electromechanical System
How efficient is a motor in a LEGO set? Future engineers conduct an activity where a LEGO motor-generator system raises an object to a specified height. They then show what they learned and use their measurements to calculate the energy...
Curated OER
Prairie Math
Students work together to build models of prairie plants. Using the model, they estimate the height and then measure them using metric and standard units. They write a fraction to represent their part of the whole set and compare and...
Teach Engineering
About Accuracy and Approximation
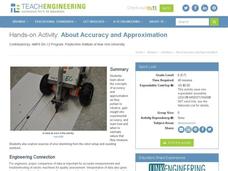
How accurate are robots? Groups draw lines by moving robots backwards and forwards by one rotation of the wheels. Using the appropriate formula, they determine the percent error in the length of the lines in relation to the calculated...
Curated OER
World's Strongest Manduca
Young scholars test the strength and speed of their Manduca. They keep their insect in a small dish and wiegh it down with pennies. They share their observations with the class.
Curated OER
A Statistical Look at Jewish History
Students complete their examination over the Jewish Diaspora. Using population figures, they discover the importance of percentages in exploring trends. They use their own ethnic group and determine how it is represented in the United...
Curated OER
Reservoir Activity
Students research the economic importance of the major reservoirs in Illinois. In groups, they manage a budget for one of the lakes to promote tourism in the area. They also work together to create advertisements.


