Shodor Education Foundation
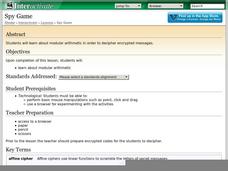
Spy Game
Turn students into detectives as they decipher encrypted messages. Introduce your class to modular arithmetic and have a little fun encrypting and decoding secret messages. The activity does not hit many content standards, but...
Curated OER
Altitude Tracking
Students estimate the altitude of a rocket during several flights. They create their own altitude tracking devise. They examine and discuss their results at the end of the activity.
Curated OER
Mean Absolute Deviation in Dot Plots
The lesson plan focuses on the ideas of dot plot representations and the mean absolute deviation of data sets.
Curated OER
Estimating With Decimals
How can we estimate the answers when working with decimals? That's what the question is as the class reviews two-digit decimal addition. Have them estimate by rounding to a whole number either before or after they have completed their...
Curated OER
Learning by Logic - Total Surface Area
Geometers calculate the area of plane surfaces using the formulas for the area of a square, rectangle, and triangle. They develop the formula for calculating the total surface area of two geometric solids: the cube and rectangular prism.
Curated OER
Minnesota-China Connections:What Time Is It?
Learners calculate the time difference between Beijing, China and their local community. They discuss how time difference affects intercultural communication.
Curated OER
Graphs: All About Our Class
Students respond to survey questions, discuss results, brainstorm ways to represent survey information, and create table of class results. They find mean, range, and percentages, and create graph to display results.
Curated OER
Maximize It!
Students design a rectangular box without a lid that has the largest possible volume using the supplied sheet of centimeter graph paper. They work in groups to construct different size boxes to determine the largest possible volume and...
Curated OER
Mean, Median, Mode, Range
Learners engage in a study of mean, median, mode, and range in order to represent data in tables. They are also exposed to the results of data that is skewed because of the outlier.
Curated OER
Shopping the Sunday Circular
Pupils demonstrate an understanding of price-per-unit mathematics. In this computation activity, learners accurately figure the unit price of grocery items. They create a chart and record the item, the price, the size and the cost per item.
Curated OER
Play It
There are a number of activities here that look at representing data in different ways. One activity, has young data analysts conduct a class survey regarding a new radio station, summarize a data set, and use central tendencies to...
Curated OER
Facial Symmetry
Learners study facial symmetry. They explore lines of symmetry, and create illustrations with multiple lines of symmetry.
Curated OER
When Average Is the Way to Go
Students engage in experiences involving the mathematical concept of averages. After watching a video, students explore averaging through a variety of different methods.
Curated OER
Operations with Signed Numbers
Students complete a variety of activities to comprehend concepts of operations with signed numbers. The integration of technology make the delivery of the lesson much more exciting for Students.
Curated OER
A Cone and Its Net
Create and investigate nets for solid shapes with your class. They identify the different parts and faces of each polygon and solid then calculate the surface area and volume of cones. They use circle sectors of varying sizes to build...
Curated OER
Integers in the Weather
Middle schoolers engage in a clever lesson that combines meteorology with mathematical thinking. They use integers in relation to high and low temperatures that they record. They use a spreadsheet of weather data, a computer, and gain...
Curated OER
Everybody Needs a Rock
Young scholars describe and classify rocks that they have chosen. They estimate and find the mass of their rocks.
Curated OER
Box and Whiskers
Middle schoolers discover how to relate collected data with a box and whiskers graph in a number of formats. They collect, organize, create, and interpret a box and whiskers graph. Pupils interpret the difference between sets of data,...
Curated OER
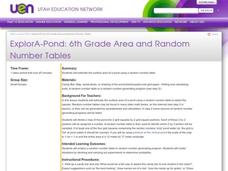
ExplorA-Pond: 6th Grade Area and Random Number Tables
Sixth graders estimate surface area of a pond using a random number table.
Curated OER
Word Problem Exchange
Students discuss elements of word problems: key words, data, computation clues, and unnecessary information and use the four steps of problem solving to find a solution and check for reasonableness.
Curated OER
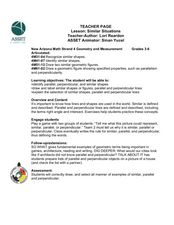
Similar Situations
Students explore intersecting lines. In this intersecting lines lesson plan, students investigate shapes consisting of parallel, perpendicular, and similar lines. Students investigate these lines in shapes around them.
Curated OER
Coordinate Geometry
Grab your class and get them graphing polygons on a coordinate plane! They investigate the four quadrants, discover the x and y axis, and correctly plot ordered pairs. To show their comprehension, each child creates a coordinate picture...
Curated OER
Prisms-Turn Up The Volume
Identify the length, width, and height of prisms. Critical thinkers calculate the volume of prisms given small amounts of information. They derive the formula given the length, width and height.
Other popular searches
- Perimeter Math Measurement
- Math Measurement Inches
- Math Measurement Lesson Plans
- Math Measurement Length
- Math Measurement Metric
- Esl Math Measurement
- Math Measurement Worksheets
- Esol Math Measurement
- Math Measurement Lessons
- Liquid Measurement in Math
- Measurement/math Literature
- Angle Measure Math
