Curated OER
Range, Mean, Median and Mode Through the Internet
Students compute measures of central tendency. In this range, mean, median and mode lesson, students gather information on the internet, organize the data and then compute the measures of central tendency. They create a persentation...
Alabama Learning Exchange
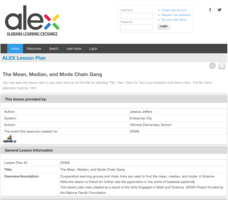
The Mean, Median, and Mode Chain Gang
Students analyze a set of data. They work in cooperative groups and use chain links to identify the mean, median, and mode of the chain.
Math Mammoth
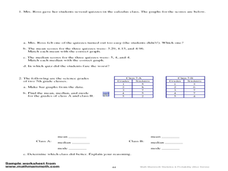
Mean, Median, and Mode One
In this mean, median, and mode learning exercise, students find the mean, median, and mode for different problems of money, weight, and more. Students complete 6 problems.
Curated OER
Madley Brath #39 - Stem and Leaf Plots, Mean, Median, Mode and Range
In this measures of central tendency worksheet, students draw a stem and leaf plot of a set of test scores. They compute the mean, median, mode, and range of the data set, and round the answers to the nearest tenth.
Curated OER
Find the Mean, Median, Mode & Range
In this numbers worksheet, learners study 6 different sets of numbers. Students, for each set of numbers, find the mean, median, mode and range. Learners put their answers in the boxes provided.
Curated OER
Ice Cream
Students explore the concepts of mean, median, mode, and range as they elicit data about people's favorite flavor of ice cream. A practical application of the data obtained offers an extension to the lesson plan.
Curated OER
Guess-timating Fun
Learners estimate the number of items in a jar and write their estimate boldly on a piece of paper. They line up holding their numbers. Then, they calculate the median, mean, mode and average of the guesses.
Curated OER
Data Analysis
Young statisticians use and interpret measures of center and spread such as mean, median, and mode as well as range. They use box plots to represent their data and answer questions regarding the correspondence between data sets and the...
Curated OER
Starting With Stats
Statisticians analyze a data set of student IQs by finding measures of central tendency and dispersion such as mean, median, mode, and quartiles. They practice using a graphing calculator to find the values and analyze box plots and...
Curated OER
Super Ticket Sales
Use this graphing data using box and whisker plots lesson to have learners make box and whisker plots about ticket sales of popular movies. They find the mean, median, and mode of the data. Pupils compare ticket sales of the opening...
Curated OER
Measures of Central Tendency
Here is a measures of central tendency worksheet in which learners solve five multiple choice problems. They find the mean, median, and mode of a data set.
Curated OER
Investigating Median, Mode, and Mean
Learners develop strategies to organize data while following teacher demonstration. They calculate the mean, median and mode of a data set while determining the relationships between the numbers. They analyze data from tables and double...
Noyce Foundation
Ducklings
The class gets their mean and median all in a row with an assessment task that uses a population of ducklings to work with data displays and measures of central tendency. Pupils create a frequency chart and calculate the mean and median....
Shodor Education Foundation
Skew Distribution
Slide the class into a skewed view. Learners alter the location of the median relative to the mean of a normal curve to create a skew distribution. They compare the curve to a histogram distribution with the same skewness.
Shodor Education Foundation
Plop It!
Build upon and stack up data to get the complete picture. Using the applet, pupils build bar graphs. As the bar graph builds, the interactive graphically displays the mean, median, and mode. Learners finish by exploring the changes in...
Curated OER
Means, Medians, and Modes
In this math worksheet, students find the mean, median, and mode for each set of numbers. Then they apply the methods to the word problems.
Curated OER
Dynamic Data Range, Mode, and Median
Students practice statistics skills by calculating range, mode, and median. In this 4th - 6th grade lesson plan, students calculate range, median, and mode of given numbers while playing a game.
Curated OER
Mean, Median and Range
In this measures of central tendency worksheet, students solve 6 problems. Students analyze the set of given numbers and calculate the median, mean and range for each.
Curated OER
Mean, Median, Mode and Range
In this math worksheet, students learn to find the mean, median, mode and range of a set of data. Students read the information and answer 5 questions in which they calculate mean, median, mode and range.
Curated OER
Mode, Median, and Mean
Students define mode, median and mean, and perform mathematical operations to determine these 3 terms. In this statistics/math lesson plan, students practice memory strategies to help distinguish between mode, median, and mean. Students...
Curated OER
Using mean, median, and mode
In this mean, median, and mode activity, students read how to use each method and then complete problems using each one. Students complete 8 problems.
Curated OER
TAKS Math Quiz-Median
In this TAKS math quiz worksheet, learners take an online quiz focused on finding median. Quiz may be graded online by clicking a link.
Curated OER
Candy Colors: Figuring the Mean, Median, and Mode
Students count candy by color and then calculate mean, median, and mode. They count candy and use the data to calculate mean, median, and mode (by color) and apply their learning to another collection of data.
Curated OER
Mean, Median, and Mode
Learners calculate measures of central tendency. in this mean, median, and mode lesson, students calculate the measures of central tendency. They organize data, examine and explain the statistics.
Other popular searches
- Mean, Median, Mode
- Mean Median Mode
- Graphing Mean, Median, Mode
- Free Mean, Median, Mode
- Math; Mean, Median, Mode
- Mean Median Mode Range
- Mean, Median, Mode Range
- Mean Median and Mode
- Mathematics Mode and Median
- Median and Mean Statistics
- Mean, Median, Mode, Range
- Mean Median


