Curated OER
Factoring Polynomials
For this Algebra II/college level worksheet, learners use the discriminate to determine if a polynomial has factors with integral coefficients and factor polynomials, including factoring by pulling out the GCF and factoring by grouping....
Curated OER
Quadratic Functions
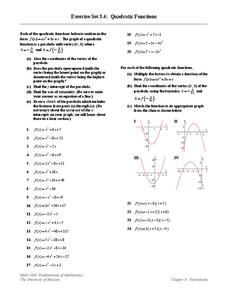
In this graphing quadratic equations worksheet, young scholars find the vertex and graph the parabola for 24 quadratic equations. The final four are factored into binomials to increase accuracy of the x intercepts.
Curated OER
Solving Equations by Factoring
For this algebra worksheet, learners use the Zero Product Property to solve polynomial equations by factoring. Application problems are included. The one page interactive worksheet contains fifty-four problems. The solution steps and...
Curated OER
Math Sleuths
Help learners practice their math skills by utilizing the Internet to research a mathematical topic. Your math sleuths will investigate a science or social studies topic from their curriculum and construct a Math Hunt Grid. They create a...
Curated OER
Just Me and My Shadow
Students take measurements throughout the day using a simple sundial called a gnomon. They record the results on a Data Log and convert from English units to metric (S.I.) units. Data points are plotted on the same graph and analyzed.
Curated OER
Polynomials
In this worksheet, students solve and complete 32 various types of problems. Included are problems on simplifying polynomials, factoring, graphing equations by plotting points, and simplifying expressions using the rules of...
Curated OER
How Long Can You Go?
Eighth graders examine the usefulness of a line of best fit by collecting and graphing data, using a graphing calculator to determine the line of best fit, and making a variety of predictions. They watch a video, then design a...
Curated OER
4.3 Introduction to Probability
In this probability activity, students find the experimental probability of given events. This one-page activity contains eleven problems.
Curated OER
6.5 Absolute-Value Equations and Inequalities
In this absolute value equations instructional activity, students solve absolute-value equations and inequalities. They graph answers on a number line. This one-page instructional activity contains 34 problems.
Curated OER
Graph It!
There is more than one way to represent data! Learners explore ways to represent data. They examine stacked graphs, histograms, and line plots. They conduct surveys and use stacked graphs, histograms, or line plots to chart the data they...
Curated OER
Influence and Outliers
Using the TI-Nspire calculator, statisicians identify outliers and their effect on the least-squares regression line. In finding the line of best fit, they determine what points will affect the least squares regressions and what points...
Curated OER
Range, Cluster, Gap and Outliers
There are a number of activities here where learners collect and record data, as well as, activities where the likelihood of an event happening is calculated given the experimental probability. Young statisticians organize information...
Curated OER
Quantitative Data
In this quantitative data worksheet, pupils compute measures of central tendency, draw vertical line diagrams, and compare collected data. This 23-page worksheet contains approximately 100 multi-step problems. Explanations and examples...
Curated OER
Histograms
Young statisticians explore the concept of histograms. They construct histograms of various data such as change in a student's pocket, and guessing on a test. hHey analyze data represented as a histogram and a box plot and compare...
Curated OER
State Names: Frequency
Data grathers determine the frequency of specified data. They identify the frequency that specified letters occur in the names of all 50 states. They create stem-and-leaf plots, box-and-whisket plots and historgrams to illustrate the data.
Curated OER
Dot Plots
Number crunching statisticians explore displaying data with dot plots and define the difference between quantitative data and qualitative data. Dot plots are created based on a set of given data and analyzed.
Curated OER
Data Analysis
Young statisticians use and interpret measures of center and spread such as mean, median, and mode as well as range. They use box plots to represent their data and answer questions regarding the correspondence between data sets and the...
Curated OER
Starting With Stats
Statisticians analyze a data set of student IQs by finding measures of central tendency and dispersion such as mean, median, mode, and quartiles. They practice using a graphing calculator to find the values and analyze box plots and...
Curated OER
Data Collection and Presentation
Middle and high schoolers collect and analyze data from four different activities. The activities include information about classmates, tallying colors of cars in a parking lot, stem and leaf plots, and making a histogram from winning...
Curated OER
Comparison of Univariate and Bivariate Data
Learners explore the concept of univariate and bivariate data. In this univaritate and bivariate data lesson, pupils discuss the differences between univariate and bivariate data. They work sample problems where they must construct box...
Curated OER
Finding Factors
In this finding factors worksheet, learners practice finding all the factors of 24 in twenty word equations and then find the prime factorization in ten equations.
Curated OER
Nutria And The Disappearing Marsh
Young analysts examine changes in the nutria population, vegetation density, and marsh area over time in the wetlands of Louisiana. They import data and use the TI-73 Explorer to graph and analyze the effects of nutria on marsh loss.
Gatsby Charitable Foundation
Four Activities Using Straight Line Graphs
This math packet includes four different activities which puts linear equations and line of best fit in the context of real world applications. Each activity uses a different linear math modeling equation and asks the learners to...
Curated OER
Residential Power System
Perform data analysis on energy consumption to apply algebraic expressions to the real world. Learners will write and solve equations that answer various questions from residential power use. They will collect data at home and calculate...


