Curated OER
What's in a Graph?
How many yellow Skittles® come in a fun-size package? Use candy color data to construct a bar graph and a pie chart. Pupils analyze bar graphs of real-life data on the Texas and Massachusetts populations. As an assessment at the end...
Curated OER
Weather or Not!
Seventh graders discuss weather. In this meteorology lesson, 7th graders view a movie on weather and take a quiz. They work in groups to make weather tools for a class weather station.
Teach Engineering
Alloy the Way to Mars
Future engineers test different alloys to determine the specific strength of each one. Based on the results, they make a recommendation to NASA on which alloy to use on engines for spacecraft.
Shodor Education Foundation
Algebra Quiz
Reviewing the process of solving equations is as easy as one click of a button. Scholars solve linear and quadratic equations by using a helpful interactive. The computer app automatically scores responses, providing immediate feedback...
Shodor Education Foundation
Algebra Four
Everybody wins when you play Algebra Four. Players solve linear and quadratic equations to earn pieces on the Algebra Four game. Make a row of four pieces and you win the game. But everyone gets practice with solving equations, so really...
Shodor Education Foundation
Data Flyer
Fit functions to data by using an interactive app. Individuals plot a scatter plot and then fit lines of best fit and regression curves to the data. The use of an app gives learners the opportunity to try out different functions to see...
Shodor Education Foundation
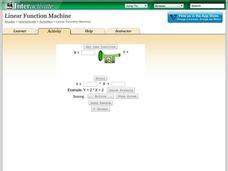
Linear Function Machine
What goes in must come out! Learners play with a function machine to determine the correct function. They enter input values and watch as the machine produces the output.
Shodor Education Foundation
Incline
Study velocity while examining graphical representations. As scholars work with the animation, they discover the effect the height of an incline has on the velocity of the biker. They make conclusions about the slope of the...
Shodor Education Foundation
Graphit
No graphing calculator? No worries, there's an app for that! Young mathematicians use an app to graph functions. In addition, they can also plot data points.
Shodor Education Foundation
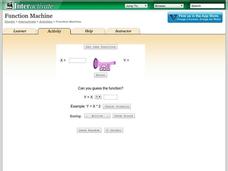
Function Machine
Machines can be so helpful sometimes. A simple interactive has learners enter input values for a function machine and observe output values. These values help determine a function that represents the input-output relationship in the...
Shodor Education Foundation
Equation Solver
Solve your equation and prove it, too. Young mathematicians solve linear equations using an interactive. They must input a property to justify each step of their solutions.
Shodor Education Foundation
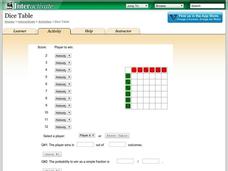
Dice Table
Convert a table to probabilities. Pupils set up the winning rules for the sums of two dice. Using the rules, the applet fills out a table showing the winners for each combination. Learners determine the probabilities of winning for each...
Shodor Education Foundation
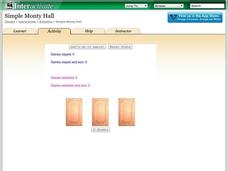
Simple Monty Hall
What's behind door number one? A fun resource lets learners simulate the classic Monty Hall probability problem. Pupils choose a door, and after they select a losing door, they decide whether to switch or stay. Using their decisions, the...
Shodor Education Foundation
Buffon's Needle
Find the needle on a lined paper. Pupils run a simulation of dropping a needle on a lined paper. The probability of the needle crossing at least one line is pi/2. After each trial, the interactive displays the approximation of pi based...
Shodor Education Foundation
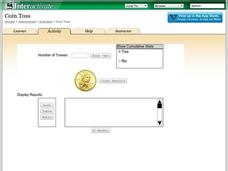
Coin Toss
Are your young mathematicians having a hard time making heads or tails of probabilities? It's no toss up—here is a resource that's sure to straighten them out! Learners run the interactive to toss a coin a different number of times....
Shodor Education Foundation
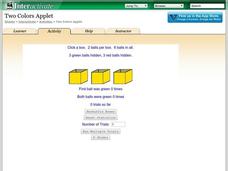
Two Colors Applet
Find the box with two green balls. The applet uses six balls, three green and three red, and hides them in three boxes. Pupils choose a box and click on it to reveal the color of balls inside. Using the chosen box, the simulation keeps...
Shodor Education Foundation
Pythagorean Explorer
Make sure the measurement is right. The interactive provides right triangles with a missing side measurement. Pupils use the given sides and the Pythagorean Theorem to calculate the length of the missing side. After entering the length,...
Shodor Education Foundation
Skew Distribution
Slide the class into a skewed view. Learners alter the location of the median relative to the mean of a normal curve to create a skew distribution. They compare the curve to a histogram distribution with the same skewness.
Shodor Education Foundation
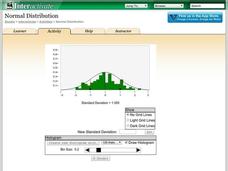
Normal Distribution
Does the size of the bin matter? The resource allows pupils to explore the relationship between the normal curve and histograms. Learners view histograms compared to a normal curve with a set standard deviation. Using the interactive,...
Curated OER
Geometry: Translations and Reflections
Group work and participation is used to perform a specified translation or reflection. In this geometrical translation lesson plan, small groups of pupils are each given a shape to plot on a coordinate grid. Each shape is then translated...
Curated OER
CO2 and You
Students study the scientific evidence about carbon dioxide emissions. They learn to calculate the amount of energy used by different appliances. They complete a worksheet which analyzes the amount of energy that their home uses.
Curated OER
What's the Frequency, Roy G. Biv?
Introduce starting space scientists to the electromagnetic spectrum, expecially the portion of visible light. Teach them about wavelength and frequesncy. Then give them a roll of adding machine tape and a manila folder to make a...
Curated OER
Action-Reaction! Rocket
Students construct a rocket from a balloon propelled along a guide string. They use this model to learn about Newton's three laws of motion, examining the effect of different forces on the motion of the rocket. They measure the distance...
Curated OER
Map that Habitat
Students participate in an activity that replicates the creation of sea floor bathymetry by taking a simplified form of soundings in the classroom. They discuss sea floor mapping technologies, sonar, soundings, and remote sensing,...
Other popular searches
- Math and Science Careers
- Integrated Math and Science
- Science and Math
- Science/ Math Games
- Math and Science Activities
- Integrating Math and Science
- +Math and Science Careers
- Math and Science Plan
- Math and Science Lessons
- Word Origins Science Math
- Math in Science Experiments
- Science Math

