Curated OER
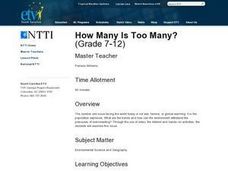
How Many Is Too Many?
Learners explore the population explosion. They view a video depicting the exponential growth of human population. Students research the internet to project future population data. They perform hands-on, multimedia activities to study...
Curated OER
World in the Balance
Students make estimates on how many people they believe live on Earth. While watching a video, they take notes on the issues facing Kenya, Japan and India. In groups, they calculate how long it takes for a country to double in size. To...
Curated OER
How Many Animals?
Students use their math skills to develop estimates for the population of several animal species native to the Austrailian rainforest. It is a simulation that researchers at the Center for Rainforest Studies in Australia perform to...
Curated OER
Wildlife Management
Learners examine the effects of various management strategies on the size of wildlife populations. Each student simulates the management of an animal population in a card game, graphs the results of the wildlife game, and participate in...
Concord Consortium
People and Places
Graph growth in the US. Given population and area data for the United States for a period of 200 years, class members create graphs to interpret the growth over time. Graphs include population, area, population density, and population...
Curated OER
Using Random Sampling to Draw Inferences
Emerging statisticians develop the ability to make inferences from sample data while also working on proportional relationships in general. Here, young learners examine samples for bias, and then use random samples to make inferences...
EngageNY
Why Worry About Sampling Variability?
Are the means the same or not? Groups create samples from a bag of numbers and calculate the sample means. Using the sample means as an estimate for the population mean, scholars try to determine whether the difference is real or not.
EngageNY
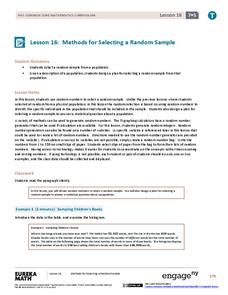
Methods for Selecting a Random Sample
Random sampling is as easy as choosing numbers. Teams use random numbers to create a sample of book lengths from a population of 150 books. The groups continue by developing a technique to create samples to compare from two populations...
EngageNY
End-of-Module Assessment Task: Grade 7 Mathematics Module 5
Show learners how to use simulations and random sampling to reach conclusions with the last resource in a 25-part series. The assessment contains three scenarios, each with several parts, and covers comparing populations using random...
Houghton Mifflin Harcourt
Random Samples: Estimating Population
With this estimating populations assignment, your class will learn about taking random population samples and calculating the average number of species in the samples to estimate the total population. Students use the given data to find...
Curated OER
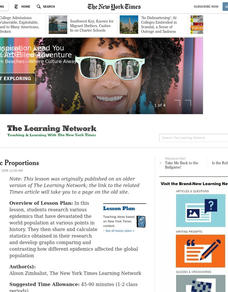
Epidemic Proportions
Students research epidemics that have devastated world population at various points in history. They share and calculate statistics obtained in their research and develop graphs comparing and contrasting how different epidemics affect...
Curated OER
U.S. Population Hits 300 Million
Students read a story about the population in the United States reaching 300 million, and answer vocabulary and comprehension questions about it. In this population lesson plan, student respond to literature by answering questions,...
Curated OER
Population Counts
Students investigate the analytical processes used to interpret the 2001 Canadian census. They examine the population statistics and trends.
Curated OER
Chesapeake Bay Population Studies
Learners use quarter meter2 quadrant to determine population density, relative density, frequency, relative frequency, calculate diversity index, and establish correlation of association between any two species.
Curated OER
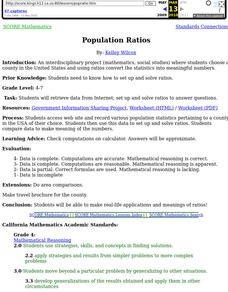
Population Ratios
Students access web site and record various population statistics pertaining to a county in the USA of their choice. They use this data to set up and solve ratios. They compare data to make meaning of the numbers.
NOAA
Sustaining Our Ocean Resources
Lead young scientists on an investigation of fishery practices with the final installment of this four-part unit. Using a PowerPoint presentation and hands-on simulation, this instructional activity engages children in learning how fish...
K20 LEARN
If Our Classroom Were The World: Proportions And Percents
It's a small world after all. Classmates consider world population, languages, and religions in a cross-curricular lesson. Applying percentages and proportions, they determine what the class make-up would be if the class represented the...
CCSS Math Activities
Smarter Balanced Sample Items: 7th Grade Math – Target H
Not one but two box plots. How will your pupils fare? Assess their understanding of box plots by having them compare two populations. The eighth of nine installments in the Gr. 7 Claim 1 Item Slide Shows series, the resource has them...
Mathematics Assessment Project
100 People
It's a small world after all. In the middle school assessment task, learners use data that imagines there are only 100 people in the world to answer questions about population demographics. Young mathematicians use ratio and proportional...
Noyce Foundation
Double Down
Double the dog ears, double the fun. Five problems provide increasing challenges with non-linear growth. Topics include dog ears, family trees and population data, and geometric patterns.
Curated OER
Lesson Plan C22: Government and Population
Students discuss basic structure of National Government in United Kingdom, explore electoral system of individual countries and European Union, and complete Government and Population worksheet to practice rounding, and calculating mean...
Curated OER
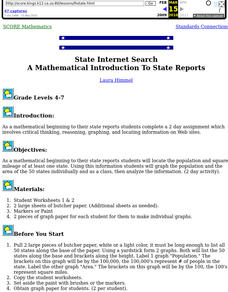
State Internet Search: A Mathematical Introduction To State Reports
Learners locate the population and square mileage of at least one state. Using this information students graph the population and the area of the 50 states individually and as a class, then analyze the information.
Curated OER
Mark-and-Recapture
Students investigate the mark-and-recapture method for estimating the population of an animal species. They evaluate given data to answer a set of questions.
Curated OER
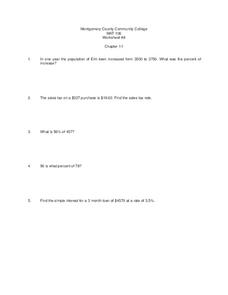
Percents
In this percents worksheet, students solve 5 different problems that include determining various percents. First, they determine the percent of increase in population over a year. Then, students determine the sales tax of a product...
Other popular searches
- Populations and Ecosystems
- Animal Populations
- Populations, Ecology
- Fish Populations
- Populations and Communities
- Deer Populations
- Bird Populations
- Limits on Populations
- Aboriginal Populations
- Human Populations
- Marine Mammals Populations
- Indigenous Populations


