Education Development Center
Making Sense of Unusual Results
Collaboration is the key for this equation-solving lesson. Learners solve a multi-step linear equation that requires using the distributive property. Within collaborative groups, scholars discuss multiple methods and troubleshoot mistakes.
S2tem Centers SC
Investigating Chance Processes of Probability
How likely is it that the school cafeteria will serve chicken tomorrow? Discover the concept of probability with the roll of the dice. Pupils evaluate the liklihood of several statments about everyday life. Then, a mathematical...
Curated OER
Mean and Standard Deviation
Get two activities with one lesson plan. The first lesson plan, is appropriate for grades 6-12 and takes about 20 minutes. It introduces the concept of measures of central tendency, primarily the mean, and discusses its uses as well as...
Mt. San Antonio Collage
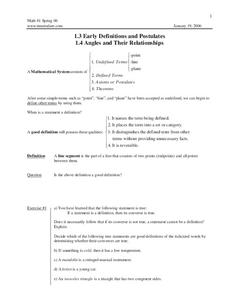
Postulates, Angles, and Their Relationships
More than a worksheet, learners go through geometry topics example by example on the nicely organized handout. From postulates to classifying angles, there are rules and examples provided for each topic. The ten pages of problems provide...
Curated OER
Transformations and Translations in Geometry
In this transformations and translations in Geometry worksheet, learners use geometric shapes and grids to translate six transformations in each of two activities.
EduGAINs
Introduction to Solving Linear Systems
Word problems offer class members an opportunity to learn the concept of solving linear systems using graphs. Individuals choose a problem based upon preferences, break into groups to discuss solution methods and whether there is...
Beyond Benign
Truckin’ to Your Table
Food takes a trip to the table. Class members choose a meal from a menu and calculate the total cost of the meal including tax and tip. Using a food origin card, pupils determine how far each of the ingredients of a meal traveled to end...
MARS, Shell Center, University of Nottingham
Defining Regions Using Inequalities
Your young graphers will collaboratively play their way to a better understanding of the solution set produced by the combining of inequalities. Cooperation and communication are emphasized by the teacher asking questions to guide the...
Curated OER
One-Variable Inequality Word Problems
Here is a great set of eight scenarios that require the writing of a one-variable inequality and then solving to find the solution. This inequality word problem activity is then followed by the solutions to each of the eight problems.
Big Kid Science
Measuring Shadows Using an Ancient Method
How did ancient peoples determine the height of really tall objects? Young scientists and mathematicians explore the concept of using shadows to measure height in a hands-on experiment. Paired pupils measure shadows, then calculate the...
Curated OER
The Trash We Pass
Where does our garbage go? What is the difference between a recyclable and non-recyclable item? Pose these important, but often overlooked, questions to your class and invite them to consider the lasting and damaging effects of the...
Illustrative Mathematics
Fixing the Furnace
This comprehensive resource applies simultaneous equations to a real-life problem. Though the commentary starts with a graph, some home consumers may choose to begin with a table. A graph does aid learners to visualize the shift of one...
Mathed Up!
Pie Charts
Representing data is as easy as pie. Class members construct pie charts given a frequency table. Individuals then determine the size of the angles needed for each sector and interpret the size of sectors within the context of frequency....
Education Development Center
Similar Triangles
Model geometric concepts through a hands-on approach. Learners apply similar triangle relationships to solve for an unknown side length. Before they find the solution, they describe the transformation to help identify corresponding sides.
Education Development Center
Proof with Parallelogram Vertices
Geometric figures are perfect to use for proofs. Scholars prove conjectures about whether given points lie on a triangle and about midpoints. They use a provided dialogue among fictional students to frame their responses.
EngageNY
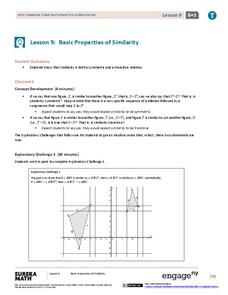
Basic Properties of Similarity
Does the symmetry and transitive property apply to similarity? The 10th segment in a series of 16 presents the class with a group of explorations. The explorations have pairs show that similarity is both symmetrical and transitive. It...
EngageNY
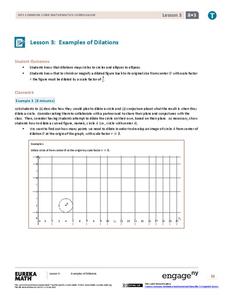
Examples of Dilations
Does it matter how many points to dilate? The resource presents problems of dilating curved figures. Class members find out that not only do they need to dilate several points but the points need to be distributed about the entire curve...
EngageNY
Dilations on the Coordinate Plane
Dilations from the origin have a multiplicative effect on the coordinates of a point. Pupils use the method of finding the image of a point on a ray after a dilation to find a short cut. Classmates determine the short cut of being able...
EngageNY
The Graph of a Linear Equation in Two Variables Is a Line
Show your class that linear equations produce graphs of lines. The 20th segment in a unit of 33 provides proof that the graph of a two-variable linear equation is a line. Scholars graph linear equations using two points, either from...
EngageNY
Geometric Interpretations of the Solutions of a Linear System
An intersection is more than just the point where lines intersect; explain this and the meaning of the intersection to your class. The 26th segment in a 33-part series uses graphing to solve systems of equations. Pupils graph linear...
EngageNY
Informal Proof of AA Criterion for Similarity
What does it take to show two triangles are similar? The 11th segment in a series of 16 introduces the AA Criterion for Similarity. A discussion provides an informal proof of the theorem. Exercises and problems require scholars to apply...
Fredonia State University of New York
Watch Your Step…You May Collide!
Can two lines intersect at more than one point? Using yarn, create two lines on the floor of the classroom to find out. Cooperative groups work through the process of solving systems of equations using task cards and three different...
West Contra Costa Unified School District
Sneaking Up on Slope
Pupils determine the pattern in collinear points in order to determine the next point in a sequence. Using the definition of slope, they practice using the slope formula, and finish the activity with three different ways to determine the...
Illustrative Mathematics
Bike Race
A graph not only tells us who won the bike race, but also what happened during the race. Use this resource to help learners understand graphs. The commentary suggests waiting until the end of the year to introduce this topic, but why...
Other popular searches
- Multicultural Math Lessons
- Dr. Seuss Math Lessons
- Powerpoint Math Lessons
- Thanksgiving Math Lessons
- Esl Lessons Math
- Elementary Math Lessons
- Math Lessons Place Value
- Kindergarten Math Lessons
- 2nd Grade Math Lessons
- Math Lessons Pre Algebra
- Manipulatives Math Lessons
- Halloween Math Lessons


