Illustrative Mathematics
Calculating the square root of 2
Does a calculator give you the exact value of the square root of 2? Here, learners must decide if 1.414236 is equal to the square root of 2. They must also explain why the square root of 2 could never be equal to a terminating decimal....
Mathematics Assessment Project
Comparing Lines and Linear Equations
Scholars first complete an assessment task on writing linear equations to model and solve a problem on a running race. They then take part in a card matching activity where they match equations and graphs of lines to diagrams of fluid...
Mathematics Assessment Project
Building and Solving Linear Equations
Young scholars write and solve linear equations in one variable based on descriptions of the operations that are applied to the unknown variable in an algebra machine. They then create their own problems for classmates to solve.
Bowland
Magic Sum Puzzle
Learners discover the magic in mathematics as they solve numerical puzzles involving magic sums. They then make a conjecture as to why no additional examples are possible based on an analysis of the puzzles.
EngageNY
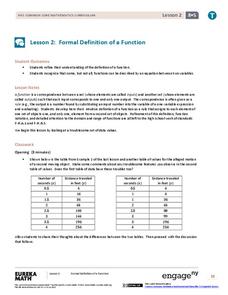
Formal Definition of a Function
Formalize the notion of a function. Scholars continue their exploration of functions in the second lesson of the module. They consider functions as input-output machines and develop function rules for selected functions.
Curated OER
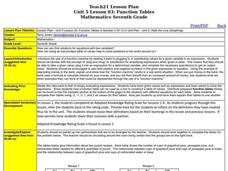
Function Tables
Students identify function using tables of data. In this algebra instructional activity, students create a tale of point and plot on a coordinate plane. They analyze the graph as being a function or not.
Curated OER
Impossible Graphs
Young scholars practice plotting functions on the Cartesian coordinate plane while participating in a discussion about the Possible Or Not worksheet/activity. Students also use the Impossible Graphs worksheet to practice reading a graph,...
Curated OER
60-30-10
Middle schoolers use ratios and proportions to represent quantitative relationships as they investigate the concept of how percentages are used by designers. Students decorate the same room using three different percentages of colors.
Robert Gordon University
Indices
The laws of exponents are written on a handy reference sheet. Note that since this worksheet was written in the UK, powers or exponents are also called indices (singular: index). If this does not pose a problem for you, the concepts and...
Curated OER
Inequalities and The Order of Operations
Middle and high schoolers investigate how to solve inequalities. The activity has a good guide for taking pupils through a direct instruction of the concept. You can use counting tiles in order to help kinesthetic learners.
Curated OER
Adding And Subtracting Polynomials
Students investigate the concept of adding and subtracting polynomials. They put terms in the correct order in order to solve them vertically. They simplify first with combining like terms and then conducting the calculations. The...
Curated OER
Inequalities 7.3
Graph inequalities and discuss the difference in their slopes. Learners observe rate of change as they compare linear, quadratic, and cubic functions.
Curated OER
I want a credit card--or do I?
Students pretend to borrow $1000.00 on a credit card. They pretend to make the minimum payments for a year. When they're done, they make a pie chart showing how much of their payments reduced their debt, and how much was interest.
Curated OER
Exponents Worksheet: 2 of 2
Not the most attractive worksheet, but useful nonetheless. A chart is displayed for mathematicians to fill in the power, base number, exponent, the repeated multiplication problem, and the total value. They complete this activity for...
Curated OER
How Fast Is Your Car?
Eighth graders discover the relationship between speed, distance, and time. They calculate speed and represent their data graphically. They, in groups, design a ramp for their matchbox car. The goal is to see who's ramp produces the...
Curated OER
Chart Your Course
Middle schoolers explore change represented in graphs comparing distance and time. They exchange and share their graphs. Students interpret and create distance versus time line-graphs, and write stories based on these graphs. They...
Curated OER
There's Gold in Them Thar Ratios
Students draw a model of the bunny problem which generates the Fibonacci Sequence, spirals generated from golden rectangles and golden triangles; identify the golden ratio in the human body, and find the Fibonacci numbers in nature.
Curated OER
Tower of Hanoi
Students look for a pattern to solve an ancient puzzle. In this logic and reasoning math lesson, students work to solve the problem of moving the Tower of Hanoi, then listen to a legend about a monk moving a 64-disc tower and determine...
Curated OER
The Business of Interest
Students learn about finance and money management and use math to solve problems, communicate, and explore real life situations as they deal with banks. In this financial management lesson, students apply their math skills to real life...
Curated OER
River Optimization Problem
Young scholars define the different methods used for optimizing a particular element of a problem. In this optimization problem lesson, students optimize appropriate details of a problem using data collection, algebra, technology, and/or...
Curated OER
Mine Shaft Grade 8 Slope
Eighth graders investigate slopes using real life scenario. For this algebra lesson, 8th graders model and interpret real life data. They plot their data in a coordinate plane and discuss the results with the class.
Curated OER
Large Number Concept
Eighth graders compare objects to large numbers. In this algebra lesson, 8th graders compare large numbers to daily objects. Relate large numbers to the real world by discussing the Holocaust and the number of people who lost their lives.
Curated OER
Pardon me. Do You Have exChange for a Dollar?
Students are familiar with United States currency-dollar and cents. They are asked to compare it with currency of another country. Students explore currencies of various countries using the Internet, video, and hands-on activities. ...
Curated OER
Parabola (Lab Version)
Students develop definition for parabola, explain relationship between properties of the graph of a parabola and its equation, explain how the equation of a parabola can be written in different forms, and solve problems that relate the...


