Curated OER
1.2 Points, Lines and Planes
This is a lengthy overview PowerPoint that defines, explains, shows examples, and has practice problems about points, lines and planes. The class will need to write many notes and there is an example of how to set up in the Cornell...
Curated OER
8th Grade Math Parallel and Transversal Lines
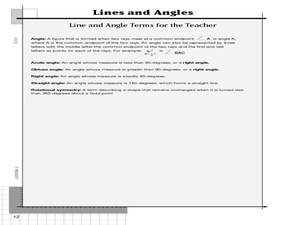
Eighth graders label and define geometrical lines and angles. They identify angles on the board as acute, obtuse, straight, or right. In groups, 8th graders build with masking tape on the wall a pair of parallel lines, and a transverse...
Curated OER
Lines and Angles with K'NEX
Here is a geometry lessonwhich invites learners to create models using their knowledge of lines, segments, rays, and angles. This lesson reinforces geometric vocabulary and concepts through practical application, it also includes...
EngageNY
Informally Fitting a Line
Discover how trend lines can be useful in understanding relationships between variables with a lesson that covers how to informally fit a trend line to model a relationship given in a scatter plot. Scholars use the trend line to make...
Charleston School District
Parallel Lines Cut by a Transversal
Pupils study angle measurements between different types of angles associated with parallel lines and transversals. The independent practice asks pupils to identify the types of angles in a diagram and to determine the measure of angles.
Gatsby Charitable Foundation
Four Activities Using Straight Line Graphs
This math packet includes four different activities which puts linear equations and line of best fit in the context of real world applications. Each activity uses a different linear math modeling equation and asks the learners to...
EngageNY
Determining the Equation of a Line Fit to Data
What makes a good best-fit line? In the 10th part of a 16-part module, scholars learn how to analyze trend lines to choose the best fit, and to write equations for best-fit lines to make predictions.
Curated OER
Animal Brains
Do big bodies make big brains? Let your learners decide whether there is an association between body weight and brain weight by putting the data from different animals into a scatterplot. They can remove any outliers and then make a line...
EngageNY
There is Only One Line Passing Through a Given Point with a Given Slope
Prove that an equation in slope-intercept form names only one line. At the beginning, the teacher leads the class through a proof that there is only one line passing through a given point with a given slope using contradiction. The 19th...
Curated OER
Basic Compass and Ruler Construction: Line Segment
In this construction worksheet, learners utilize a compass and a ruler to reconstruct a line segment and to combine two line segments together in 2 questions.
Alabama Learning Exchange
Writing Equations for Parallel Lines
Acquaint your class with the concept of parallel lines. Learners watch a PowerPoint presentation about how to write equations of parallel lines. Their understanding of linear equations and slope is taken a step further by the exercises...
National Research Center for Career and Technical Education
Finance: Depreciation (Double Declining)
Of particular interest to a group of business and finance pupils, this activity explores depreciation of automobile values by comparing the double declining balance to the straight line method. Mostly this is done through a slide...
American Statistical Association
Scatter It! (Predict Billy’s Height)
How do doctors predict a child's future height? Scholars use one case study to determine the height of a child two years into the future. They graph the given data, determine the line of best fit, and use that to estimate the height in...
Curated OER
Graphing Lines That Don't "Fit"
How can you graph lines that don't seem to fit on the given graph? What makes a line straight? What does the rate of change mean when graphing a line? How do you know if a slope is positive or negative? How do you know if the graph of a...
Curated OER
Interpreting and Displaying Sets of Data
Students explore the concept of interpreting data. In this interpreting data lesson, students make a line plot of themselves according to the number of cubes they can hold in their hand. Students create their own data to graph and...
Curated OER
Constructing Parallel Lines
Students construct parallel lines using a protractor and a straightedge. In this geometry lesson, students identify the properties of parallel lines. They use Cabri to graph and observe the lines.
Curated OER
Straight Line Graphs
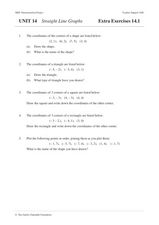
In this math worksheet, students plot lines on a graph paper when given the equation for the line in slope-intercept form. They tell the values of the slope and the y-intercept. Students find the x and y intercepts and plot three lines....
Curated OER
Searching for Angles and Lines
Pupils work to find and reinforce concepts related to lines and angles. They identify the characteristics of shapes that have one, two, and three dimensions. The students also work on definitions related to the geometry of shapes.
Curated OER
Am I Straight
Identify the slope of a linear equation in this algebra lesson. Middle schoolers graph linear equations using slopes and intercepts. They identify the slope as being positive, negative, no slope, or undefined.
Curated OER
Slopes and Lines
Students identify the slopes of a line. In this algebra instructional activity, students calculate the slope and intercept of a line. They graph their lines using a TI calculator.
American Statistical Association
What Fits?
The bounce of a golf ball changes the result in golf, mini golf—and a great math activity. Scholars graph the height of golf ball bounces before finding a line of best fit. They analyze their own data and the results of others to better...
American Statistical Association
You and Michael
Investigate the relationship between height and arm span. Young statisticians measure the heights and arm spans of each class member and create a scatter plot using the data. They draw a line of best fit and use its slope to explain the...
American Statistical Association
Scatter It! (Using Census Results to Help Predict Melissa’s Height)
Pupils use the provided census data to guess the future height of a child. They organize and plot the data, solve for the line of best fit, and determine the likely height and range for a specific age.
Balanced Assessment
A Fishy Story
There's nothing fishy about this resource. In the task, learners use given information about fish prices to create a scatter plot and line of best-fit. Later, they use the information to answer questions about the profit from fish sales.
Other popular searches
- Tracing Straight Lines
- Curves Using Straight Lines
- Graph Straight Lines
- Math Straight Lines
- Measuring Straight Lines
- Straight Lines Art
- Straight Lines High School
- Sewing Straight Lines


