Curated OER
Senior Analysis
In this senior analysis worksheet, students solve and complete 10 various types of problems. First, they graph each function completely. Then, students label the axes and show a table for each. They also determine if the graph is a...
Curated OER
Discussion Sheet 2
In this math worksheet, students consider a two dimensional graph and then create two equations for revolving it around the axes.
Curated OER
Worksheet 7, Polynomials
In this algebra worksheet, students graph 3 polynomial functions. They find the intercepts, and the intervals above the x axis. Students create their own polynomials with given characteristics.
Curated OER
Mathematics Within: Algebraic Patterns
Students discover patterns in linear equations by playing a dice game to collect data. They graph the data and analyze the patterns of the lines created by the data. The class then compares the individual graphs to evaluate the position...
Curated OER
XY Graph
In this math worksheet, students practice graphing ordered pairs, linear equations, or quadratic equations using this graph with the x and y axis.
Shasta County Office of Education
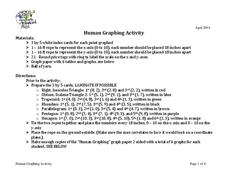
Human Graphing Activity
Take graphing outside and make a giant coordinate plane to plot your human points. Young graphers are each given a coordinate for a particular shape and asked to make the geometrical shapes one by one. Those not plotted are to write down...
Charleston School District
Analyzing Scatter Plots
Scatter plots tell a story about the data — you just need to be able to read it! Building from the previous lesson in the series where learners created scatter plots, they now learn how to find associations in those scatter plots. They...
Gatsby Charitable Foundation
Four Activities Using Straight Line Graphs
This math packet includes four different activities which puts linear equations and line of best fit in the context of real world applications. Each activity uses a different linear math modeling equation and asks the learners to...
Curated OER
Trigonometry Review Sheet
Get the trig facts fast, and use the review sheet as a guide in the classroom. The worksheet also includes a document version if any changes are needed to the problems. The information includes a small degree/radian chart, a graph of all...
Mt. San Antonio Collage
Quadratic Functions and Their Graphs
Starting with the basics, learners discover the features of a parabola and the ways to accurately graph it. After pupils practice with graphing, the end of the activity focuses on application type problems.
Mt. San Antonio Collage
Graphs of Rational Functions
Sometimes graphing rational functions can feel a little "irrational." Starting with the basics, learners work their way through the pieces of these graphs and finish off with an application question.
Mt. San Antonio Collage
Quiz 2: Types of Functions
Here is a resource that provides the structure of an assessment with the convenience of a full answer key. The focus is on rational, exponential, and logarithm functions with a few questions on solving polynomials.
Curated OER
Writing and Graphing Linear Equations on a Flat Surface
In this linear equations worksheet, students write the equation of a line with given characteristics. They identify the slope of a line and the y-intercept. Explanations and examples are provided at the beginning of the worksheet. This...
Kuta Software
Reflections of Shapes
In this reflection of shapes worksheet, learners graph images on a coordinate plane. They reflect the image and sketch it on the graph. They write a rule to describe the transformation. This four-page worksheet contains 14 problems....
EngageNY
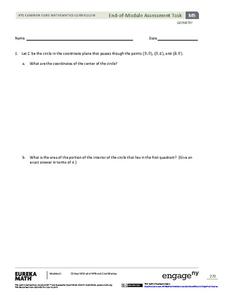
Geometry Module 5: End-of-Module Assessment
The lessons are complete. Learners take an end-of-module assessment in the last installment of a 23-part module. Questions contain multiple parts, each assessing different aspects of the module.
Curated OER
Writing Linear Equations in Slope-Intercept Form
For this writing linear equations worksheet, students find the x- and y-intercepts of 4 equations. Students then write equations for 4 problems given the slope and y-intercepts. Additionally, students rewrite 4 standard form equations in...
Firelands Local Schools
Exponential Growth and Decay
How can you safely model exponential growth and decay? A hands-on activity uses candies to model not only exponential decay, but also exponential growth. Exponential equations are fitted by hand and by use of a calculator to the data...
Illustrative Mathematics
Graphs of Power Functions
There are parent functions, and then there are parent functions with a really interesting way to explore them. High schoolers are asked to graph different combinations of parent functions together and determine the point of intersection....
02 x 02 Worksheets
Inverse Variation
Discover an inverse variation pattern. A simple lesson plan design allows learners to explore a nonlinear pattern. Scholars analyze a distance, speed, and time relationship through tables and graphs. Eventually, they write an equation to...
University of Texas
A Library of Parent Functions
Don't think this lesson is for Mom and Dad; parent functions are all for your high schoolers. Flip through a presentation with a focus slide on each type of graph and its characteristics. Some examples are included but the focus is on...
CCSS Math Activities
Social Security Trust Fund
Will Social Security still be around when you retire? Given data on the predicted balance of the social security fund over time, scholars plot the points on a coordinate grid and determine if a quadratic regression fits the data. They...
Virginia Department of Education
Quadratic Curve of Best Fit
Class members create a table of the number of chords that can be drawn given the number of points on a circle. Pupils analyze the data created, find a function to fit to it, and use the function to make further predictions.
Illustrative Mathematics
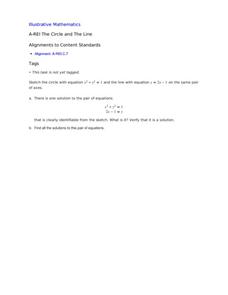
The Circle and The Line
Here is a resource where algebra learners show their understanding of a system of equations involving a circle and a line. Once graphed, learners see two points of intersection, one where the ordered pair is read, and a second where...
West Contra Costa Unified School District
Comparing Linear and Quadratic Functions
If a linear function and a quadratic function enter a boxing match, which one would win? Learners first review how to find key features of linear and quadratic functions. Next, they compare key features of pairs of functions.


