CK-12 Foundation
Single Bar Graphs: Hockey Teams
Raise the bar for hockey fans. Using data about favorite hockey teams, pupils build a bar graph. They use the information from the graph to make comparisons and solve one- and two-step problems.
Curated OER
Cosmic Bar Graphs
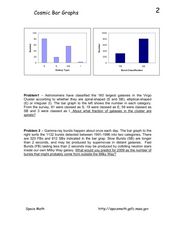
In this cosmic bar graph worksheet, students solve 2 problems using given bar graphs that plot the number of galaxies vs. the galaxy type and the number of gamma-ray bursts vs. the burst classification. Students find the fraction of...
Curated OER
Integrated Algebra Practice: Frequency Histograms, Bar Graphs and Tables
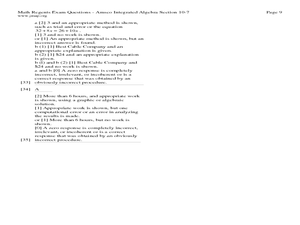
In this graphs worksheet, students solve 4 problems about histograms, bar graphs, and tables. Students answer questions about histograms, bar graphs, and tables.
BW Walch
Solving Systems of Linear Equations
Solving systems of equations underpins much of advanced algebra, especially linear algebra. Developing an intuition for the kinds and descriptions of solutions is key for success in those later courses. This intuition is exactly what...
Curated OER
Temperature Bar Graph
Learners explore mean, median and mode. In this math lesson, students analyze temperature data and figure the mean, median, and mode of the data. Learners graph the data in a bar graph.
Curated OER
Play It
There are a number of activities here that look at representing data in different ways. One activity, has young data analysts conduct a class survey regarding a new radio station, summarize a data set, and use central tendencies to...
Curated OER
Build a Skittles Graph
Students construct a bar graph with a given set of data. They calculate the ratio and percent of the data. Students discuss alternate ways of graphing the data as well as multiple strategies to approach the task.
West Contra Costa Unified School District
Talking About Distance, Rate and Time
Connect the tortoise and the hare fable to mathematics. Learners first identify key terms related to distance, rate, and time. They then solve distance/rate/time problems using different representations.
Curated OER
Timed Multiplication Test Graphs
Students use the tools of data analysis for managing information. They solve problems by generating, collecting, organizing, displaying histograms on bar graphs, circle graphs, line graphs, pictographs and charts. Students determine...
Bowland
Mystery Tours – Plan Your Tour
Everyone loves a vacation and a set of three activities has groups planning a tour of the U.K. using given distance, time, and price data. They solve a variety of problems related to the trip and produce a report on the success of the trip.
Curated OER
Box It Up
Students use a six-step problem solving method to design a box/container. They are given the criteria for evaluation when presented with the problem. Students keep a notebook on processes, procedures, material, cost, design, machines,...
Georgia Department of Education
The Basketball Star
Have learners use math to prove they are sports stars! Assess a pupil's ability to create and analyze data using a variety of graphs. The class will be motivated by the association of math and basketball data.
Curated OER
GSE Foundations of Algebra: Equations and Inequalities
Need lessons on writing and solving one- and two-step linear equations and inequalities, as well as systems of equations? This comprehensive 106-page module from the Georgia Department of Education contains many different lessons for a...
Curated OER
Interpreting and Displaying Sets of Data
Students explore the concept of interpreting data. In this interpreting data lesson, students make a line plot of themselves according to the number of cubes they can hold in their hand. Students create their own data to graph and...
Curated OER
Count The Letters
Students perform activities involving ratios, proportions and percents. Given a newspaper article, groups of students count the number of letters in a given area. They use calculators and data collected to construct a pie chart and bar...
Curated OER
A Thanksgiving Survey
Students conduct a survey. In this math lesson, students design and conduct a survey about Thanksgiving foods. Students display the collected data in a graph and use the graph to determine what food to serve for a Thanksgiving meal.
Curated OER
Creating Line Graphs
Learners draw line graphs. In this math instructional activity, students interpret minimum wage data and graph the data in a line graph. Learners predict the next minimum wage and figure the earnings for a 40 hour work week for someone...
Curated OER
Mathematics Module
Delve into graphing! The concepts covered begin with basic graphing basic coordinates and algebraic expressions on coordinate planes, and build up to graphing linear inequalities and equations. Learners solve and simplify various...
Curated OER
The Haar Wavelet Filter Bank
In this Haar Wavelet worksheet, students solve and complete 4 different problems related to the Haar Wavelet filter bank. First, they define the properties of Haar basis. Then, students compute the matrices for the first, second and...
Curated OER
Active Learning
Students practice using measurements and bar graphs to solve a running problem in this active Math lesson for various age levels. The lesson meets state standards in Mathematics and requires the use of "math journals" for final...
Curated OER
When Am I Ever Going to Use this?
Students solve problems using equations and properties of integers. In this algebra lesson, students solve problems using ratio and proportion and graph their answers on a coordinate plane. They solve word problems using geometry.
Curated OER
Using Systems of Equations
In this algebra instructional activity, students solve systems of equations. They use substitution, elimination and graphing to solve. There are 33 questions with an answer key.
Curated OER
Linking Real World Data to the Classroom
Students analyze data representing real life scenarios.In this algebra lesson, students collect, plot and analyze data using a graph. They use different methods to represent and present their data.
Virginia Department of Education
Normal Distributions
Pupils work to find probabilities by using areas under the normal curve. Groups work to calculate z-scores and solve real-world problems using the empirical rule or tables.


