Curated OER
Algebra I: Linear Functions
Using rates from a rental car company, young mathematicians graph data, explore linear relationships, and discuss the role of slope and the y-intercept. This lesson allows for the discussion of independent and dependent variables, as...
Flipped Math
Create and Analyze Graphs
Model the world with graphs. Pupils watch and participate in creating graphs to model real-world situations. The presenters stress the importance of a consistent scale and proper labels for the graphs along with identification of the...
Balanced Assessment
Bathtub Graph
Represent the relationship between independent and dependent variables through a modeling situation. The activity expects learners to graph the volume of water in a bathtub during a given scenario. The graph should result in two areas of...
Curated OER
Graphing and Interpreting Linear Equations in Two Variables
Graph linear equations using a table of values. Learners solve equations in two variables using standard form of an equation. They identify the relationship between x and y values.
Curated OER
The Slope of a Line
In this slope instructional activity, students examine graph and determine the slope of a line. They determine coordinates of a point to make a true statement. Students identify the dependent variable and the independent variable. ...
Curated OER
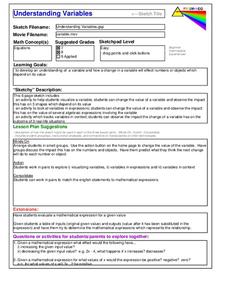
Understanding Variables
Students solve linear equations and identify the unknown. In this algebra lesson, students define a variable and use addition, subtraction, multiplication and division to solve. They change the equation depending on the value of the...
Curated OER
Perimeter Pattern
High schoolers investigate perimeter patterns formed by a hexagon and a triangle. They will identify the dependent and independent variable and write a function for the relationship.
Radford University
Pizza, Pizza!
Ponder the problem of pizza prices. Pupils use provided information about two different pricing schedules for pizza. They create tables of values and functions to represent the pricing schemes, consider domain restrictions, and identify...
Curated OER
Guess the Age
Students describe graphically, algebraically and verbally real-world phenomena as functions; identify the independent and the dependent variable. They translate among graphic, algebraic, and verbal representations of relations and graph...
Curated OER
Graphing Systems of Inequalities
Solve equations and graph systems of inequalities. Designed as a lesson to reinforce these concepts, learners revisit shading and boundaries along with solving linear inequalities.
Curated OER
Working With Equations
Students create a mathematical formula to help plan ration supplies for a polar expedition. Using basic algebra skills, students identify the variables in planning for rations. They create an equation to help plan the expedition....
NASA
Exercising in Space
Using the CEVIS space bike as a context, groups work together to calculate the settings required for astronauts to reach their necessary exercise. Pupils calculate the prescribed exercise settings and complete the last section, which can...
Shodor Education Foundation
Algebra Quiz
Reviewing the process of solving equations is as easy as one click of a button. Scholars solve linear and quadratic equations by using a helpful interactive. The computer app automatically scores responses, providing immediate feedback...
Virginia Department of Education
Linear Modeling
An inquiry-based algebra lesson explores real-world applications of linear functions. Scholars investigate four different situations that can be modeled by linear functions, identifying the rate of change, as well as the strength and...
Inside Mathematics
Coffee
There are many ways to correlate coffee to life, but in this case a worksheet looks at the price of two different sizes of coffee. It requires interpreting a graph with two unknown variables, in this case the price, and solving for those...
Curated OER
Lesson 2-5: Absolute Value Functions and Graphs
What is absolute value? What is an absolute value function? Emerging mathematicians solve equations containing variables inside an absolute value sign. They graph each function on a coordinate plane and identify the maximum and minimum...
Curated OER
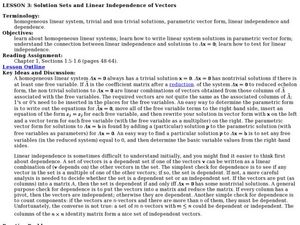
Solution Sets and Linear Independence of Vectors
Eleventh graders study homogeneous linear systems. In this linear system of equations lesson, 11th graders write linear system solutions in parametric vector form. Students also identify the connection between linear independence and...
Curated OER
Discovering Ohm's Law
Connect math with science! Pupils apply properties of Ohms Law as they solve problems and identify the inverse relationship of a function. They analyze the shape of the graph of an inverse function and use it to make predictions.
Curated OER
Algebra 1
Students study the functional relationships of a variety of problems. For this functional relationship lesson, students determine the dependent and independent quantities of a given set of data. Students record the data and write it in...
Curated OER
Fast Talker - Ch 2 project
Tongue Twisters?! Create scatter plot graphs based on timing fellow classmates saying tongue twisters. Then investigate, display, and analyze the relationships based on functions. Wrap up this activity by making a poster or other...
Curated OER
Make a Pass at Me
Learners identify different types of functions and units of measurements. In this statistics lesson plan, students will collect data, graph their data and make predictions about their data. They plot a linear regression graph.
Curated OER
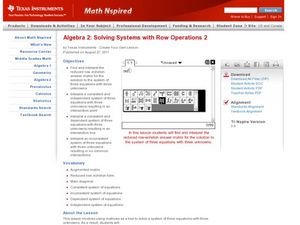
Solving Systems with Row Operations 2
Have your class solve equations using matrices by teaching them how to factor systems of equation to identify the point of intersection. They create their matrices on the Ti and perform row operations to simplify.
Curated OER
Graphing at all Levels: It's a Beautiful Thing!
Mixing math and art is done in this lesson by applying graphing knowledge to create a unique piece of art. This lesson varies acording to the graphing knowledge of the artist. First, learners identify and review various types of graphing...
Curated OER
Algebra 2 - Linear Programming
Young scholars read real world problems, determine the variables, and set up the function using algebraic statements. After entering data into the graphing calculator, they display information in the form of graphs and scatter plots. ...


