Curated OER
Algebra I: Linear Functions
Using rates from a rental car company, young mathematicians graph data, explore linear relationships, and discuss the role of slope and the y-intercept. This lesson plan allows for the discussion of independent and dependent variables,...
Curated OER
Interactivate: Introduction to Functions
This interactive website provides a variety of lesson plans according to which standards you are applying and which textbook you use. Introduce functions to your class by having them construct single operation machines and create...
EngageNY
Solution Sets to Equations with Two Variables
Can an equation have an infinite number of solutions? Allow your class to discover the relationship between the input and output variables in a two-variable equation. Class members explore the concept through tables and graphs and...
BW Walch
Creating Linear Equations in One Variable
The example of two travelers meeting somewhere along the road has been a stereotypical joke about algebra as long as algebra has existed. Here in this detailed presentation, this old trope gets a careful and approachable treatment....
Curated OER
Perimeter Pattern
High schoolers investigate perimeter patterns formed by a hexagon and a triangle. They will identify the dependent and independent variable and write a function for the relationship.
Curated OER
Graphing and Interpreting Linear Equations in Two Variables
Graph linear equations using a table of values. Learners solve equations in two variables using standard form of an equation. They identify the relationship between x and y values.
CK-12 Foundation
Sums and Differences of Independent Random Variables: Traveling Seasickness
Use a Punnett square to calculate probabilities. The resource presents a situation in which two patients are randomly selected from a group of patients with a particular illness. Pupils use the interactive to determine the likelihood...
Curated OER
Linear Equation Experiments
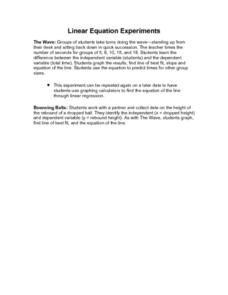
For this linear equation worksheet, students solve and complete 2 different experiments that include using linear equations. First, they determine the difference between independent and dependent variables. Then, students graph their...
Charleston School District
Solving Equations with Variables on Both Sides
Where did all these variables come from, anyway? The previous lessons in the series ask learners to solve multi-step equations using the distributive property, combining like terms, and using inverse operations. Now scholars solve...
Flipped Math
Create and Analyze Graphs
Model the world with graphs. Pupils watch and participate in creating graphs to model real-world situations. The presenters stress the importance of a consistent scale and proper labels for the graphs along with identification of the...
Curated OER
Math: Real Time and Live
Get an interdisciplinary edge. Scholars study air contamination and slope. They record the time it takes for air fresheners to reach them at variable distances. They document their times, classify them by distance, and draw a scatter...
Shodor Education Foundation
Scatter Plot
What is the relationship between two variables? Groups work together to gather data on arm spans and height. Using the interactive, learners plot the bivariate data, labeling the axes and the graph. The resource allows scholars to create...
Curated OER
What's Your Shoe Size? Linear Regression with MS Excel
Learners collect and analyze data. In this statistics lesson, pupils create a liner model of their data and analyze it using central tendencies. They find the linear regression using a spreadsheet.
Curated OER
Series Solution of the Time-Independent Schrödinger Equation
In this math worksheet, students find the solutions to the problems that apply the time-independent Schrödinger equation. They examine the relationship between the mass and energy.
Curated OER
The Slope of a Line
In this slope worksheet, students examine graph and determine the slope of a line. They determine coordinates of a point to make a true statement. Students identify the dependent variable and the independent variable. This three-page...
BW Walch
Creating and Graphing Linear Equations in Two Variables
This detailed presentation starts with a review of using key components to graph a line. It then quickly moves into new territory of taking these important parts and teasing them out of a word problem. Special care is taken to discuss...
EngageNY
Relationships Between Two Numerical Variables
Is there another way to view whether the data is linear or not? Class members work alone and in pairs to create scatter plots in order to determine whether there is a linear pattern or not. The exit ticket provides a quick way to...
NASA
Exercising in Space
Using the CEVIS space bike as a context, groups work together to calculate the settings required for astronauts to reach their necessary exercise. Pupils calculate the prescribed exercise settings and complete the last section, which can...
Balanced Assessment
Function or Not?
Is it possible for an equation to be a function and not a function at the same time? By completing a short assessment, young mathematicians answer this question. Class members provide an explanation on how an equation represents a...
Curated OER
Independent and Dependent
In this independent and dependent activity, students answer probability word problems dealing with a deck of cards. Students complete 5 problems.
Concord Consortium
Graphing Elements
How do you graph a sentence? Scholars do just that as they represent relationships between independent and dependent variables with a graphical representation. Given a sentence, they determine the pertinent relationship and create a...
Balanced Assessment
Bathtub Graph
Represent the relationship between independent and dependent variables through a modeling situation. The activity expects learners to graph the volume of water in a bathtub during a given scenario. The graph should result in two areas of...
Shodor Education Foundation
Incline
Study velocity while examining graphical representations. As scholars work with the animation, they discover the effect the height of an incline has on the velocity of the biker. They make conclusions about the slope of the line in terms...
Curated OER
Integers
Students explore integers through a review of basic knowledge and understanding of integers. They order integers on a number line and evaluate integer expressions with variables. Students order values from variable expressions on a...


