Illustrative Mathematics
Floor Plan
A multi-step problem has learners finding the actual area based on a scale drawing and then converting units at the end. Two different solution choices are listed depending on the preference on which step to start first. Both methods can...
Mathematics Vision Project
Quadratic Equations
Through a variety of physical and theoretical situations, learners are led through the development of some of the deepest concepts in high school mathematics. Complex numbers, the fundamental theorem of algebra and rational exponents...
Curated OER
Correlation of Variables by Graphing
Middle and high schoolers use a spreadsheet to graph data. In this graphing lesson, learners determine how two parameters are correlated. They create a scatter plot graph using a computer spreadsheet.
Curated OER
Describing Data
Your learners will practice many ways of describing data using coordinate algebra in this unit written to address many Common Core State Standards. Simple examples of different ways to organize data are shared and then practice problems...
West Contra Costa Unified School District
Correlation and Line of Best Fit
Computers are useful for more than just surfing the Internet. Pupils first investigate scatter plots and estimate correlation coefficients. Next, they use Microsoft Excel to create scatter plots and determine correlation coefficients and...
Virginia Department of Education
Exponential Modeling
Investigate exponential growth and decay. A set of six activities has pupils collecting and researching data in a variety of situations involving exponential relationships. They model these situations with exponential functions and solve...
Curated OER
Points, Lines, Planes, and Space
In this points, lines, planes, and space worksheet, students solve word problems dealing with points, lines, planes, and space. Students complete 20 individual problems and 20 group problems.
Achieve
Ground Beef
Ever wonder how a butcher creates the different types of ground beef? Young mathematicians explore the methods butchers use to create their desired ground beef quality. Given a combination of two types of meat with varying leanness,...
Curated OER
Tale of the Tape
How can baseball and skeet-shooting be modeled mathematically? Sports lovers and young mathematicians learn how to use quadratic equations and systems of equations to model the flight paths of various objects.
Curated OER
Birds' Eggs
More than just data, scatter plots are full of information that can be used to answer a variety of questions. This lesson uses a plot with information about bird egg sizes to answer questions about the relationship between length and...
NASA
Lights on the International Space Station
Groups explore illumination with NASA's Lighting Environment Test Facility (LETF) as a context. Using the TI-Nspire app, groups determine the lux equation that models their simulation. They then use the lux equation to solve problems...
Curated OER
A Model Solar System
If Earth is modeled by a grapefruit, what planet could be represented by a golf ball? This activity uses everyday and not-so-everyday objects to create a model of the Solar System.
Houston Area Calculus Teachers
Area and Volume
An AP calculus lesson begins with an activity to determine the volume of a solid using a cross-section. Next, learners review the ways to find the area between two curves , as well how to find the volume of a solid created from the...
Curated OER
Water Down the Drain
Did you know that leaky faucets waste $10 million worth of water? Conservationists perform an experiment and draw best-fit lines to explore how the US Geological Society determined this value.
EngageNY
The Height and Co-Height Functions of a Ferris Wheel
Show learners the power of mathematics as they model real-life designs. Pupils graph a periodic function by comparing the degree of rotation to the height of a ferris wheel.
Illustrative Mathematics
Modeling London's Population
Looking at London's population from 1801–1961 in 20 year increments, high school mathematicians determine if the data can be modeled by a given logistic growth equation. They explain their thinking and determine the values of each...
Virginia Department of Education
Logarithmic Modeling
Explore logarithms and logarithmic regression. Young mathematicians first learn about inverse functions and about the logarithm function family. They take their newfound knowledge to use logarithmic functions to model situations and...
Curated OER
Interpreting and Displaying Sets of Data
Students explore the concept of interpreting data. In this interpreting data lesson, students make a line plot of themselves according to the number of cubes they can hold in their hand. Students create their own data to graph and...
Curated OER
Scatter Plots and Line of Best Fit – TV Task
This handout begins by asking your statisticians to form hypotheses on the correlation between test scores and student height and test scores and the number of hours watching TV. Then using specific data, your class will create scatter...
Curated OER
Cost Calculations Lesson Plan
Learners analyze data using graphs and equations. In this algebra instructional activity, students calculate the cost of lumber, convert price per foot to price per piece, solve equations using addition and subtraction and give exact...
Curated OER
Building A Nation
Students build their own nation in groups where they create a name, flag, declaration of independence, form of government, mathematical layout, and more. In this nation lesson plan, students also provide a scale drawing of their nation...
Curated OER
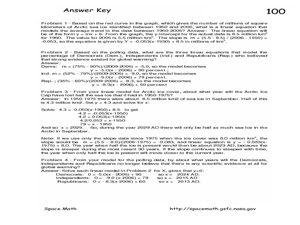
The Global Warming Debate and the Arctic Ice Cap
In this global warming and the Arctic ice cap worksheet, students use two graphs showing data about the amount of Arctic sea ice between 1950 and 2006 and the percent of people surveyed that believe the Earth has gotten warmer over the...
Curated OER
Can You Carry a Tune in a Bucket?
Young scholars use water filled pipes to play a tune and consider the mathematics behind the sound waves. In this sound wave lesson, students play a tune with water filled pipes. They create a mathematical model to evaluate the...
Curated OER
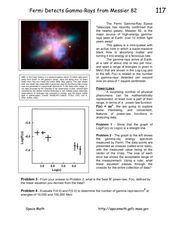
Fermi Detects Gamma-Rays from Messier
In this power law function worksheet, students use data from the Fermi Gamma-Ray Space telescope to apply the power law function to physical phenomena. Students use a graph to solve four problems.
Other popular searches
- Linear Measurement Grade 3
- Convert Linear Measurement
- Grade One Linear Measurement
- Linear Measurement Unit Plan
- Math Linear Measurement
- Linear Measurement Lessons
- Technical Linear Measurement
- Math Linear Measurement
- Metric Linear Measurements
- Adding Linear Measurements
- Measurement Customary Linear
- Linear Measurement Metric


