Kenan Fellows
Reading Airline Maintenance Graphs
Airline mechanics must be precise, or the consequences could be deadly. Their target ranges alter with changes in temperature and pressure. When preparing an airplane for flight, you must read a maintenance graph. The second lesson of...
Curated OER
Graph It!
There is more than one way to represent data! Learners explore ways to represent data. They examine stacked graphs, histograms, and line plots. They conduct surveys and use stacked graphs, histograms, or line plots to chart the data they...
Alabama Learning Exchange
Building Functions: Inverse Functions from Tables and Graphs
Is the inverse a function? Scholars learn how to examine a function to answer this question. Using an online interactive, they examine the properties of inverse functions to compare to the original function.
Curated OER
Graphs and Functions
Middle schoolers describe plotting functions on the Cartesian coordinate plane. They solve functions on paper and using an online tool to plot points on a Cartesian coordinate plane creating lines and parabolas.
Inside Mathematics
Sorting Functions
Graph A goes with equation C, but table B. The short assessment task requires class members to match graphs with their corresponding tables, equations, and verbalized rules. Pupils then provide explanations on the process they used to...
Curated OER
Environmental Agents of Mathematics: Mathematics for Change
High schoolers analyze environmental science data using Math. They do research about renewable energy, gather data, create graphs and interpret their findings. Then the group presents their arguments persuasively using their findings to...
Illustrative Mathematics
Walk-a-thon 2
During a walk-a-thon your learners must determine the walking rate of Julianna's progress. Using tables, graphs, and an equation, they must be able to calculate the time it took her to walk one mile and predict her distance based on the...
West Contra Costa Unified School District
Motion Problems
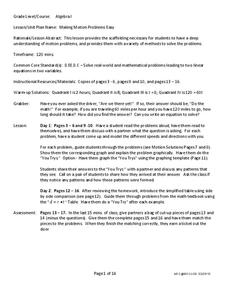
Let's hope class participants don't get motion sickness. In the lesson, class members first solve motion problems using tables and graphs. They then use algebraic techniques to solve motion problems.
Curated OER
Lesson 6-7: Scatter Plots and Equations of Lines
In this scatter plot worksheet, students examine tables and write a linear equation that matches the table. Students graph linear equations. They read scatter plots, determine the trend line, and write a linear equation to match...
Curated OER
Exploring Renewable Energy Through Graphs and Statistics
Ninth graders identify different sources of renewable and nonrenewable energy. In this math lesson, learners calculate their own carbon footprint based on the carbon dioxide they create daily. They use statistics to analyze data on power...
Illustrative Mathematics
US Garbage, Version 1
An interesting example of a discrete function and how it is applies to the real world. This could easily make a good collaborative lesson with an environmental science class. Practice reading a table and drawing a scatter plot make up...
Curated OER
Weather, Data, Graphs and Maps
Students collect data on the weather, graph and analyze it. In this algebra lesson, students interpret maps and are able to better plan their days based on the weather reading. They make predictions based on the type of clouds they see.
Curated OER
The Circle Graph
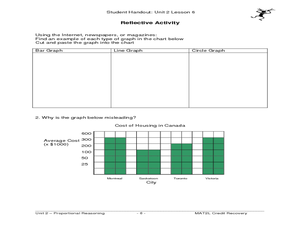
In this circle graph instructional activity, students complete problems involving many circle graphs including a compass rose, degrees, and more. Students complete 7 activities.
Concord Consortium
Betweenness II
Read between the curves ... quadratic curves! Young scholars analyze the graphs of two quadratic functions by writing their own function whose outputs are between the two given. They then consider intersecting quadratic functions and...
Virginia Department of Education
Normal Distributions
Pupils work to find probabilities by using areas under the normal curve. Groups work to calculate z-scores and solve real-world problems using the empirical rule or tables.
Curated OER
Is the Hudson River Too Salty to Drink?
Students explore reasons for varied salinity in bodies of water. In this geographical inquiry lesson, students use a variety of visual and written information including maps, data tables, and graphs, to form a hypothesis as to why the...
Curated OER
Graphing Linear Equations Using Data Tables
Students review the Cartesian plane and the process of plotting points. In groups, students create tables, identify the slope and y-intercept, and graph the equation. Afterward, students perform the same process, only, individually. As a...
Curated OER
Graphing and Interpreting Linear Equations in Two Variables
Graph linear equations using a table of values. Learners solve equations in two variables using standard form of an equation. They identify the relationship between x and y values.
Curated OER
Math Handbook: Trigonometry
You'll be spinning in unit circles once you read through this jumbo-sized resource of everything you need to know about trigonometry. Each page has color-coded examples with explicit directions that detail the problems and formulas.
Mathed Up!
Histograms
Class members explore how to read and use histograms by watching a video on creating and analyzing histograms. To finish, the class works on a set of questions that tests these skills.
Mathed Up!
Cumulative Frequency and Box Plots
Learn how to display data. Young data analysts watch a video to review how to create cumulative frequency histograms and box plots. They work on a set of questions to practice producing these data displays.
Curated OER
Tables, Charts and Graphs
Students examine a science journal to develop an understanding of graphs in science. In this data analysis lesson, students read an article from the Natural Inquirer and discuss the meaning of the included graph. Students create a...
Curated OER
Linear Equations Data Tables
Students graph linear equations on a Cartesian plane. After describing data tables and their use, students explore how the information from a table can be used to create a line graph. They discuss reasons for plotting a minimum of...
Curated OER
Using Data Analysis to Review Linear Functions
Using either data provided or data that has been collected, young mathematicians graph linear functions to best fit their scatterplot. They also analyze their data and make predicitons based on the data. This instructional activity is...


