K20 LEARN
Microbes and Manure = Biofuel
Waste not, want not! Science scholars explore manure as an alternative energy source through reading and experimentation. Groups construct their own biofuel digesters and observe the process of methane production. The teacher's guide...
K20 LEARN
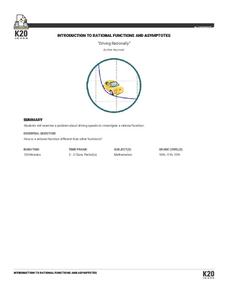
Driving Rationally: Introduction To Rational Functions And Asymptotes
Calculating average speeds is not as simple as finding an average. The lesson introduces class members to rational functions by presenting a problem about finding an average speed for the rest of a trip. Pupils develop an equation to...
K20 LEARN
Simply Elementary, Watson!
Explore the process of inductive and deductive reasoning. A collaborative lesson has some groups apply an inductive approach and others a deductive approach. Through class discussion, scholars compare their processes and discuss...
K20 LEARN
Do Placebos Kill Minotaurs?
But it's just a game! Learners play a game to learn basic concepts of statistical hypothesis testing. After using the digital-game module, pupils develop their own statistical hypotheses and test them.
K20 LEARN
Cumbersome Cubes
Halving is not always so simple. Small groups build a cube and then determine how to construct a cube that is half the size. Groups create two cubes, one that is the correct size and another that would be an alternative solution. To...
K20 LEARN
Ace in the Hole
How does inertia affect an object's trajectory? After watching a video on safety belt use, pupils discuss the notions of inertia. Using their knowledge, individuals try to drop a ball on a target while running, and classmates observe the...
K20 LEARN
Are We Golden?
Lead your class on a search for precious bones. Using a presentation, the class investigates the golden ratio in art and nature. Groups of pupils measure specific bones and find the average ratio for the class. To further cement the...
K20 LEARN
Round and Round We Go
Connect the dots on trigonometry with K'nex. Scholars use a K'nex model of a Ferris wheel to collect data points to plot on a height versus time graph. They'll then consider what type of function best models the data in the graph—and...
NASA
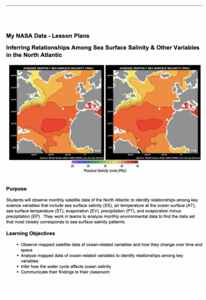
Inferring Relationships Among Sea Surface Salinity & Other Variables in the North Atlantic
Some say a picture is worth a thousand words—even from a hundred miles away! Learners review satellite data to analyze ocean variables such as temperature, salinity, evaporation, and precipitation. They look for patterns in the data and...
NASA
Earth’s Energy Budget - Seasonal Cycles
Earth's energy budget should be in the red. Young researchers review satellite data in a presentation to study Earth's solar radiation. They make both qualitative and quantitative observations about variations in available seasonal...
University of California
Jewish Holidays
Modern Jewish holidays have ancient roots with many connections to today. Using photographs of primary sources, such as fragments of a shofar, as well as texts, such as the Hebrew Tanakh, learners explore how Jewish holidays reflect...
NASA
Behavior Over Time: Analyzing Seasonal Soil and Air Properties
Moisture can affect air temperatures and so much more! An analysis of NASA soil moisture data allows pupils to make connections between climate and weather features. They first review general data and then select a specific location to...
NASA
Blossoms Blooming: Analyzing Plant Growth Patterns
Could the seasons be changing? Using National Park data, learners recognize patterns in the growth of seasonal plants. They look specifically at the first bloom date of cherry blossoms in Washington DC and compare them to temperature...
NASA
Introduction: Building Claims from Evidence
Making a claim without supporting it has little value. Learners work on their claim-making skills in a well-designed lesson. They view still images from a video and make claims using support from the visual representations. They then...
NASA
Hurricanes as Heat Engines
Hurricanes are a destructive yet fascinating phenomenon. Individuals examine evidence that hurricanes use thermal energy from the ocean as they approach land. Learners use images, charts, and graphs to collect data and then draw...
Teach Engineering
Java Programming: Testing the Edges
Tests are no fun, but test cases are extremely helpful. Pupils work in groups to write a Java program that completes a given task. They come up with test cases to give to another group, then trade test cases to determine if their program...
Teach Engineering
Java Code: Does It Work? Test and Test Again
Testing software code can sure test one's patience. Future programmers learn about the importance of testing when writing code for computer software. They access the CodingBat website to test programs written in Java using three test...
American Statistical Association
Nonlinear Modeling: Something Fishy
There are plenty of fish in the sea, but only a few good resources on regression. Young mathematicians first perform a linear regression analysis on provided weight and length data for fish. After determining that a linear model is not...
American Statistical Association
A Tale of One City and Two Lead Measurements
Lead the way in learning about lead contamination. Pupils first read several articles about the Flint water crisis and the EPA's rules for lead concentration. They use provided data from 71 Flint water wells to compute the 90th...
American Statistical Association
How Long Are the Words in the Gettysburg Address?
It's 268 words, but one only needs to consider 10 of them at a time. A data collection and analysis activity has learners investigate the lengths of words in the Gettysburg Address. They first self-select a sample of 10 words and...
American Statistical Association
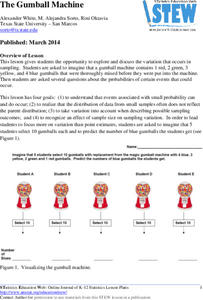
The Gumball Machine
Chew on an activity for probability. Given information on the number of gumballs in a gumball machine, scholars consider how likely it is to randomly draw a blue gumball and how many of each color they would draw in 10 trials if the...
University of California
Religious Influences
While the Roman empire often conjures up images of soldiers and emperors, its culture was more complex. Using primary sources, including ancient historians and pictures of artifacts, pupils consider the religious influences on Roman...
University of California
Silk Roads
We take for granted globalization today, but its roots run deep within China centuries ago. Using texts from ancient Chinese historians and photographs of items showing growing Eurasian trade, scholars look at the traces of...
University of California
Hellenistic Culture
It doesn't take long to change the world! Alexander the Great's reign may have been short-lived, but his vision for a multi-cultural Hellenistic world shaped Afroeurasia for centuries. Pupils examine documents, such as excerpts from...


