NASA
Exploring Exoplanets with Kepler
Calculate the movement and properties of planets like professional astronomers! Scholars use Kepler's third law to find Mercury and Venus's distance from the sun. Using changes in brightness of distant stars and Kepler's third law,...
Flipped Math
Unit 12 Review: Probability and Normal Distributions
It's time to assess probability knowledge. Individuals complete a set of problems to review concepts from the unit. They identify outcomes and sample spaces, determine compound and conditional probabilities, and investigate situations...
NASA
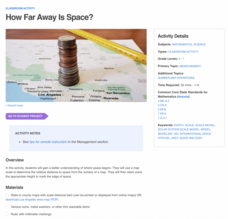
How Far Away Is Space?
Space is about 60 miles from the surface of Earth. Pupils make calculations to model that distance by stacking coins the appropriate height using scale. They then explore the distance to objects in space such as satellites and the space...
Flipped Math
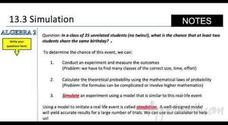
Simulations
Simulate an exciting graphing calculator-based lesson. Individuals watch and participate creating simulations using the random number generator in a graphing calculator to answer probability problems. Learners then build simulations to...
Flipped Math
Experimental Design
Experimentally, come up with a study design. Learners hear about different types of study designs, observational studies, and experiments. They identify the subjects, response variable, treatment, and whether there was a cause and...
Flipped Math
Sampling Methods
Pupils watch a video to learn about different types of sample design and how to use technology to create a random sample. They discover different types of bias that may happen due to the sampling design or the questions. Learners use...
Utah Education Network (UEN)
Statistics
Find the value in analyzing data values. Statistics is the focus in the fifth of seven installments of the 6th Grade Math series. Individuals learn to examine dot plots, histograms, and box plots by considering the shape, mean, median,...
Flipped Math
Correlation
Determine how close the line is to the scatter plot. Clear video instruction shows how to plot a scatter plot and find the best fit line using the linear regression function on a calculator. Pupils use the information from the calculator...
Flipped Math
Unit 5 Review: Bivariate Data
The data says it's a wrap. Pupils work through four review questions with multiple parts dealing with bivariate data. Questions cover creating and interpreting two-way tables and scatter plots with lines of best fit. Scholars finish up...
Flipped Math
Frequency Tables
What's the association? Pupils watch a presentation on creating a two-way frequency table. Learners find out how to calculate relative frequencies within the table to determine whether there is an association between the two categories....
Flipped Math
Unit 4 Review: One Variable Statistics
It's always nice to slow down and review. Scholars work on problems covering concepts on one-variable statistics. They create and interpret box plots and stem-and-leaf plots, determine the mean, median, mode, interquartile range, and...
Bowland
Tuck Shop
Correct a misleading conclusion. Individuals review a set of data and a conclusion to determine what is wrong with the conclusion. Pupils then represent the data with an appropriate display. Finally, learners develop a correct conclusion...
Bowland
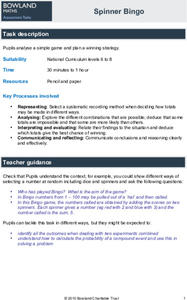
Spinner Bingo
Create a winning card. Given a description of a bingo game using two spinners, pupils determine which of three cards has the greatest chance of winning. Scholars then determine which are the best numbers to put on their own cards to give...
Bowland
Counting Trees
Let's find a way to determine how many there are. Given a diagram of trees on a plantation, pupils devise a way to estimate the number of old and new trees. Using their methods, learners create estimates for the number of the two types...
Children’s Hospital of Philadelphia
Discovery and Development of Vaccines
Stop the spread. Pupils work through two activities to gain an understanding of vaccines and immunity. Learners research different types of vaccines and how they are made and explore the advantages and disadvantages of them. Using a...
Children’s Hospital of Philadelphia
Development of Disease and Infection
It's all in the cards. Using cards to simulate a disease's attack on the immune system, pupils develop an understanding of how the immune system and pathogens react to each other and why at times the pathogen wins. Groups play a game to...
Bowland
Lottery
Take a chance on raising money. Learners calculate probabilities to determine whether a lottery is a good way to raise money. Pupils determine the number of combinations of choosing two numbers between one and six. Using the sample...
National Institute of Environmental Health Sciences
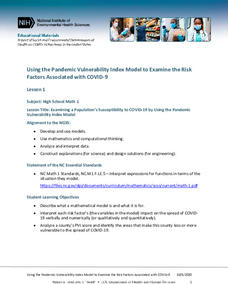
Lesson 1: Using the Pandemic Vulnerability Index Model to Examine the Risk Factors Associated with COVID-19
How vulnerable are you to COVID-19? High school mathematicians use the Pandemic Vulnerability Index to create models that help them collect and analyze data about the risk factors associated with COVID-19. After investigating four groups...
EngageNY
Selecting Evidence and Partner Writing: Aligning “The Hero’s Journey” and The Lightning Thief (Chapter 5)
Around and around we go! Scholars work in groups to connect The Hero's Journey and The Lightning Thief with a Carousel of Quotes activity. They then independently reflect on the two texts and answer questions about how they connect to...
US Department of Commerce
Immigration Nation
People come and people go. Given tabular census data on the annual number of immigrants from four different regions of the world between 2000 and 2010, pupils create double bar graphs and line graphs from the data. They analyze their...
US Department of Commerce
The New Normal
Don't be normal ... be exceptional in understanding statistics. Pupils analyze six different sets of census data using histograms or normal probability plots to determine whether each data set fits a normal distribution. They then get...
US Department of Commerce
Educational Attainment and Marriage Age - Testing a Correlation Coefficient's Significance
Do women with college degrees get married later? Using a provided scatter plot of the percentage of women who earn bachelor's degrees and the median age at which women first get married over time, pupils conduct a linear regression...
US Department of Commerce
Exploring Sampling Variability - Higher Education Attainment Across The United States
More education in statistics is always beneficial. Given cards that provide the proportion of adults with bachelor's degrees in 10 random US states, scholars individually determine the sample percentage of states in which more than 30...
US Department of Commerce
Over the Hill - Aging on a Normal Curve
Nobody is too old to learn something new. Young statisticians analyze census data on the percentage of the population older than 65 years old in US counties. They fit a normal distribution to the data, determine the mean and standard...


