EngageNY
Criterion for Perpendicularity
The Pythagorean Theorem is a geometry pupil's best friend! Learners explain the equation a1b1 + a2b2 = 0 for perpendicular segments using the Pythagorean Theorem. They are able to identify perpendicular segments using their endpoints and...
EngageNY
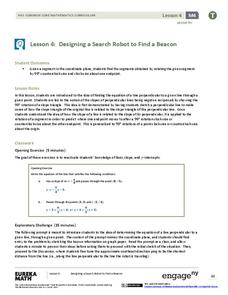
Designing a Search Robot to Find a Beacon
Build right angles using coordinate geometry! Pupils explore the concept of slope related to perpendicular lines by examining 90-degree rotations of right triangles. Learners determine the slope of the hypotenuse becomes the opposite...
Charleston School District
The Distance Between Points
Find the shortest distance from A to B using the Pythagorean Theorem! Scholars learn they can find the distance between two points by creating a right triangle using the horizontal and vertical lengths and applying the Pythagorean Theorem.
University of California
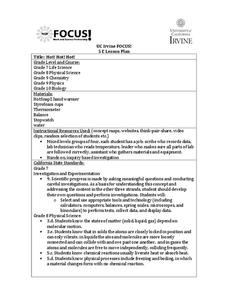
Hot! Hot! Hot!
Calories are not tiny creatures that sew your clothes tighter every night, but what are they? A science lesson plan, presented at multiple levels, has learners experiment with heat, heat transfer, and graph the function over time. It...
West Contra Costa Unified School District
Discovering Slope of a Line in Standard Form
From start to finish this skills practice resource provides a way for individuals to explore the standard form equation of a line. Begin with a warm-up, work through the problems, and then discover the relationship between the equation...
Washingtonville Central School District
Systems of Equations (Substitutes and Elimination)
With a whopping total of 66 questions, here is a resource that provides a full variety of systems of equations questions using elimination and substitution solution methods.
Kuta Software
Equations in Standard Form - Solving Systems by Graphing
Get to graphing and figure out the solution between two lines using this 14-problem worksheet. Graphs are provided for the first eight problems, but requires learners to graph the remaining six separately.
Firelands Local Schools
Exponential Growth and Decay
How can you safely model exponential growth and decay? A hands-on activity uses candies to model not only exponential decay, but also exponential growth. Exponential equations are fitted by hand and by use of a calculator to the data...
Stats Monkey
Everything I Ever Needed to Learn about AP Statistics I Learned from a Bag of M and M's®
Candy is always a good motivator! Use this collection of M&M's® experiments to introduce statistics topics, including mean, standard deviation, nonlinear transformation, and many more. The use of a hands-on model with these AP...
West Contra Costa Unified School District
Connecting Graphing and Solving Absolute Value Equations and Functions
Can you solve an equation graphically? Absolutely! This Algebra II lesson makes the connection between solving an absolute value equation and graphing two functions. Graphing absolute value functions is presented through the process of...
West Contra Costa Unified School District
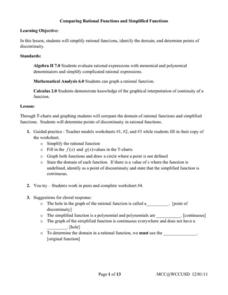
Comparing Rational Functions and Simplified Functions
What kind of functions have holes in their graphs? Here, the teacher guides the class on how to use the simplified function of a rational function to aid in the graphing of the original rational function. T-tables are used in order to...
West Contra Costa Unified School District
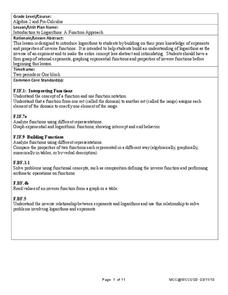
Introduction to Logarithms
Build on pupils' understanding of inverse functions by connecting logarithmic functions to exponential functions. This activity allows individuals to see graphically the inverse relationship between an exponential and logarithmic...
West Contra Costa Unified School District
Writing Exponential Functions Based on Data
Give your class a concrete example of exponential growth and decay using this hands-on activity. These Algebra II lessons allow for the exploration of exponential growth and decay models, as well as the discovery of the patterns of each....
West Contra Costa Unified School District
Solving a System by Substitution
Solving systems by substitution can be a challenging topic in algebra I. Here is a lesson that builds on students' understanding of intercepts to begin the process of substitution, and all work is reinforced graphically to build...
West Contra Costa Unified School District
Investigating the Discriminant
When is finding the discriminant enough? Using the quadratic formula helps find solutions to quadratic equations, but there are times when just using the discriminant is appropriate. Use this algebra II lesson to help classes see the...
West Contra Costa Unified School District
Introduction to Inverse Functions
Ready to share the beauty of the inverse function with your classes? This algebra II lesson guides the discovery of an inverse function through a numerical, graphical, and an algebraic approach. Connections are made between the three,...
iCivics
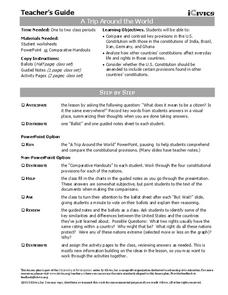
A Trip Around the World
How do the rights of citizens in other countries, such as India, Germany, Brazil, and Iran, compare to those of Americans? Take a closer look at the provisions of various foreign constitutions, and compare and contrast the protections...
iCivics
The Fourth Branch: You!
Take time to remind your young learners of the valuable understanding that each branch of the United States government is really composed of other citizens. The reading material and worksheets of this resource cover the importance of...
SHS Algebra
Transformations of Linear and Exponential Graphs
Your transformers will create and analyze graphs to discover which operations produce which transformations. Linear and exponential functions are used to model the transformations.
SHS Algebra
Linear vs. Exponential Functions Tasks
Your algebra learners will enjoy the real-life application of the three tasks presented here. They complete a table and a graph comparing the two options presented. One option is linear, while the other is exponential. After coming up...
Chapman University
Graphs of the Sine and Cosine Function in Degrees
This bright, clear, graphic, display of the sin(x) and cos(x) functions spans the domain between -360 degrees and 360 degree. Use it as a poster, handout, presentation slide, or project it onto a whiteboard.
Chapman University
Graphs of the Sine and Cosine Function in Radians
This bright, clear, graphical display of the sin(x) and cos(x) functions spans the domain between -2 pi radians and 2 pi radians. Use it as a poster, handout, presentation slide, or project it onto a whiteboard.
Curated OER
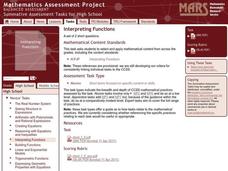
Interpreting Functions
Interpreting graphs of functions is addressed in a short worksheet. Distance as a function of time is sketched on a graph, and a few quick questions ask about their meaning. This would make a good short assessment, or a nice worksheet to...
Curated OER
Systems of Linear Inequalities
Graphing systems of linear inequalities is the focus of this worksheet. Problems range from checking solutions of inequalities, graphing systems of two inequalities, and graphing systems of three inequalities. Graphing horizontal lines,...


