Beyond Benign
Water Bottle Unit
How much plastic do manufacturers use to create water bottles each year? The class explores the number of water bottles used throughout the years to determine how many consumers will use in the future. Class members compare different...
Radford University
A Change in the Weather
Explore the power of mathematics through this two-week statistics unit. Pupils learn about several climate-related issues and complete surveys that communicate their perceptions. They graph both univariate and bivariate data and use...
College Board
2009 AP® Statistics Free-Response Questions
Preparing for a high-stakes test can be highly nerve-wracking, but understanding the test content and format helps ease the anxiety. The 2009 AP® Statistics free-response questions are available for reference. Several topics under...
College Board
2002 AP® Statistics Free-Response Questions Form B
Develop a deeper understanding of statistics. The six released free-response items from the 2002 AP® Statistics Form B involve several concepts that are currently in the regular statistics standards. Teachers see how...
Statistics Education Web
It Creeps. It Crawls. Watch Out For The Blob!
How do you find the area of an irregular shape? Class members calculate the area of an irregular shape by finding the area of a random sampling of the shape. Individuals then utilize a confidence interval to improve accuracy and use a...
College Board
2004 AP® Statistics Free-Response Questions
Provide some practice showing the work. Pupils work through six free-response questions that require them to show their work. They use their knowledge of statistics to develop solutions to problems within context. Scenarios range from...
College Board
2003 AP® Statistics Free-Response Questions
Hypothetically, knowing the structure of a test should help. Pupils use the released free-response questions from the 2003 AP® Statistics exam to become aware of the structure of questions on the test. Half the questions in the set...
College Board
2004 AP® Statistics Free-Response Questions Form B
Over the years, data analysis has been important. Looking back to the 2004 AP® Statistics Form B free-response questions, pupils and teachers see the importance of analysis of data sets. The six questions contain analysis of data on...
Curated OER
How Old Are the Stars?
Young scholars determine the age of a star cluster by observing, measuring, and plotting astronomical data. They examine the Jewe lbox cluster, located within the southern constellation Crux and determine its age.
Shodor Education Foundation
Algorithm Discovery with Venn Diagrams
Here is a lesson that takes an interesting approach to analyzing data using box and whisker plots. By using an applet that dynamically generates Venn diagrams, the class forms a strategy/algorithm for guessing the rule that fits...
Statistics Education Web
The United States of Obesity
Mississippi has both the highest obesity and poverty rate in the US. Does the rest of the data show a correlation between the poverty and obesity rate in a state? Learners tackle this question as they practice their skills of regression....
Statistics Education Web
Sampling in Archaeology
Compare different random sampling types using an archaeological setting. Scholars collect data from an archaeological plot using simple random samples, stratified random samples, systematic random samples, and cluster random samples....
Curated OER
Power Metering Project
Students collect and analyze variable data and understand the concept of electrical power. In this energy lesson students use a spreadsheet to manage their data and create box plots.
Curated OER
The Vietnam Lotteries
In this probability and statistics worksheet, students examine the “fairness” to the Vietnam draft lottery system by constructing box plots of each of the twelve months using data provided. The three page worksheet contains one...
Curated OER
Creating a Classic Comic Book
Students read a given play. They choose the key scenes from the play and write a narration to carry the plot line between those scenes. They create a comic book that depicts these key scenes, complete with pictures and text balloons.
Curated OER
Elastomers: The Best Bungee Cord
Young scholars examine elastomeric polymers in a lab activity in which they design a bungee cord. Students must determine the tensile strength, percent elongation, and plot stress versus strain graphs for their experiments on rubber...
Curated OER
Univariate Data Analysis
Students use given data to compare baseball players. They create box and whisker plots to compare the players and determine which they feel is the best player. Students use calculators to make box and whisker plots. They write paragraphs...
Curated OER
M&M Exponential Activity
Students create a scatter plot of their experimental data. In this algebra lesson, students use M&M's to determine an algebraic model. They discuss results in class.
Curated OER
Plot Your Course
High schoolers determine distance and direction on a nautical chart. In this nautical lesson plan, students identify obstacles and characteristics of common aid to navigation on a nautical chart.
Illustrative Mathematics
Speed Trap
In which direction is traffic moving faster, north or south? Use box and whisker plots to organize data and interpret the results. Detailed solutions are included. This activity would be good as a warm up or quick assessment at the...
Illustrative Mathematics
Haircut Costs
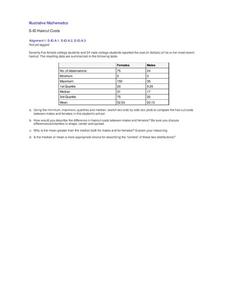
Who pays more for haircuts, men or women? Given quartile values, learners construct box and whiskers plots and interpret the results. They compare the mean and median, and discuss which is more appropriate under particular conditions....
Curated OER
More graphing situations by making a table
Students make a table and graph plotting points. For this algebra lesson, students graph linear equations on a coordinate plane. They calculate the rate of change and analyze the graph for extrapolation.
Curated OER
Describing Data
Your learners will practice many ways of describing data using coordinate algebra in this unit written to address many Common Core State Standards. Simple examples of different ways to organize data are shared and then practice problems...
Mathematics Assessment Project
College and Career Readiness Mathematics Test C1
Challenge high schoolers with a thorough math resource. The 20-page test incorporates questions from upper-level high school math in applied and higher order questions.
Other popular searches
- Analyzing Box Plots
- Outliers Box Plots
- Interpret Box Plots
- Graphs Box Plots
- Analysing Box Plots
- Leaf Box Plots
- Statistics Box Plots
- Conclude Box Plots
- Box Plots Worksheets
- Double Box and Whisker Plots
- Scatterplot Box


