GeoGebra
GeoGebra Graphing Calculator
So, exactly, what does it look like? The easily usable graphing calculator allows pupils to visualize the graph of equations and inequalities. The interactive supports any algebraic graph needed for high school mathematics and then some.
Texas Instruments
TI-Nspire™
We landed on the moon with less computing capabilities than you can find in this app! Here is a multiple function calculator that takes all the power you get from a handheld and adds the wonderful large screen that only a tablet can...
Texas Instruments
TI-Nspire™ CAS
When it comes to rating educational calculators, this calculator is always near the top of this list. Now it's available as an app. There is a lot of calculator power wrapped up in this app. Not only is this a fully functioning...
American Statistical Association
Nonlinear Modeling: Something Fishy
There are plenty of fish in the sea, but only a few good resources on regression. Young mathematicians first perform a linear regression analysis on provided weight and length data for fish. After determining that a linear model is not...
American Statistical Association
A Tale of One City and Two Lead Measurements
Lead the way in learning about lead contamination. Pupils first read several articles about the Flint water crisis and the EPA's rules for lead concentration. They use provided data from 71 Flint water wells to compute the 90th...
American Statistical Association
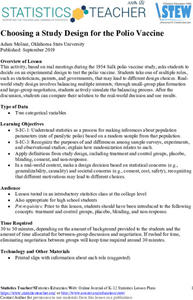
Choosing a Study Design for the Polio Vaccine
Be on the right side of history. Scholars first learn about polio and the meetings of the 1954 Salk polio vaccine study. In groups, they select roles, such as parents, government officials, and statisticians, and decide on the best...
American Statistical Association
How Long Are the Words in the Gettysburg Address?
It's 268 words, but one only needs to consider 10 of them at a time. A data collection and analysis activity has learners investigate the lengths of words in the Gettysburg Address. They first self-select a sample of 10 words and...
Rice University
Introductory Statistics
Statistically speaking, the content covers several grades. Featuring all of the statistics typically covered in a college-level Statistics course, the expansive content spans from sixth grade on up to high school. Material comes from a...
Howard Hughes Medical Institute
Beaks as Tools: Selective Advantage in Changing Environments
How does nature select some adaptations over others? Scholars experiment picking up seeds with two different types of tools simulating beaks. After practicing, they experience a drought where one type of seed suddenly isn't available....
Desmos
Desmos Graphing Calculator
They say a graph is worth a thousand points. The interactive allows users to graph a wide variety of functions and equations. Using the included keyboard or typing directly into the list, learners determine the graph of a function....
PBL Pathways
Tax Examination
What are your chances of being audited by the IRS? An engaging problem scenario asks pupils to examine the likelihood of being audited compared to factors such as receiving a refund or claiming a home office. The final product of the...
College of Marin
General Addition and Multiplication Rules of Conditional Probabilities
Making connections between multiple methods of solving problems is an important part of understanding conditional probability. The lesson shows solutions to problems using Venn diagrams, tree diagrams, formulas, and two-way tables....
Fort Bend Independent School District
Data Analysis - AP Statistics
What better way to study survey design than to design your own survey! Bring a versatile data analysis project to your AP Statistics class, and encourage them to apply the practices from their instructions to a real-world survey project.
Curated OER
Stochastic and Deterministic Modeling
Explore the difference between stochastic and deterministic modeling through programming. First have the class write algorithms for relatively simple tasks using pseudocode. Use the Python 2.7 program app to simulate Mendel's Pea Pod...
Curated OER
Human Population- Changes in Survival Rates Data Interpretation
In this human population changes in survival worksheet, students interpret and plot data to understand the differences in human mortality and survivorship between historic and modern times. They investigate how these changes influence...
Curated OER
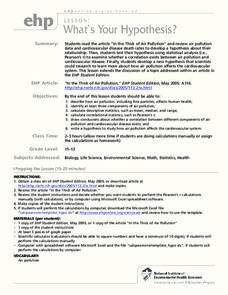
What's Your Hypothesis?
Find the article, "In the Thick of Air Pollution," not through the resource link in the lesson, but through an Internet search. Have high schoolers read it and perform calculations with the statistics provided. The objective is to...
Curated OER
Variance and Covariance: How much to do baseball players really make?
Is baseball really the road to riches? Here, statisticians look at salary data from baseball players and use variance to measure the spread of the data to more accurately answer that question. Note: The salary data provided is from 1994,...
Curated OER
Conditional Probability and Probability of Simultaneous Events
Students explore the concept of conditional probability and probability of simultaneous events. In this conditional probability and probability of simultaneous events lesson, students roll dice or use and applet to roll dice to determine...
Curated OER
Confidence Intervals: Population Mean; Population Standard Deviation Unknown
In this confidence interval worksheet, students examine given statistical information to find the margin of error. They construct a confidence interval for the population and find the mean. Seven statistical problems are available on...
Curated OER
Confidence Intervals: Population Mean; Population standard Deviation Known
In this confidence interval worksheet, students examine a given confidence level and sample data to determine the margin of error, identify a confidence interval, list the mean and give the standard deviation. Students complete seven...
Curated OER
Confidence Intervals: Population Proportions
In this interval worksheet, students examine given data to construct a confidence interval for a specified proportion. They also identify the minimum sample size needed to support the required margin of error around the population. Seven...
Curated OER
Proteomics
Students analyze data taken from proteomic experiments. In this biology lesson, students explain the importance of bioinformatics tools in the study of proteins. They evaluate scientific results using math and computer software.
Curated OER
What Are My Chances?
Students calculate probability. In this lesson on probability, students use given data to calculate to chances of a given event occurring. Many of the calculations in this lesson are applicable to daily life.
Curated OER
Z-Scores related to Psychology
In this z-score worksheet, students identify the z-scores and percentiles corresponding to thirteen values. Students are also asked to find two probabilities. Worked solutions are provided after each question.


