Curated OER
Solution Sets
Here is a task that gives the graph of the solutions of a system of linear inequalities and asks learners to analyze and write the algebraic form of the systems. By turning the problem around, learners make the connections between...
Education Development Center
Making Sense of Unusual Results
Collaboration is the key for this equation-solving lesson. Learners solve a multi-step linear equation that requires using the distributive property. Within collaborative groups, scholars discuss multiple methods and troubleshoot mistakes.
EngageNY
Analyzing a Verbal Description
What function will describe the insect population growth? Pairs or small groups work together to determine which type of function and specific function will model given scenarios. The scenarios differentiate between linear, exponential...
EngageNY
Solution Sets to Inequalities with Two Variables
What better way to learn graphing inequalities than through discovering your own method! Class members use a discovery approach to finding solutions to inequalities by following steps that lead them through the process and even include...
Curated OER
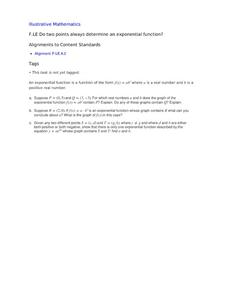
Do Two Points Always Determine an Exponential Function?
Algebra learners explore, analyze and build an exponential equation given its form and a specific point that exists on the function in this task. The last question asks learners to apply their ideas to an exponential equation given two...
Curated OER
Algebra 2 Desmos Graphing Project
Encourage class members to get creative with functions. Pairs write their names and draw pictures using a graphing application with a collaborative graphic project. The resource provides the requirements for the project, as well as a...
Fredonia State University of New York
Watch Your Step…You May Collide!
Can two lines intersect at more than one point? Using yarn, create two lines on the floor of the classroom to find out. Cooperative groups work through the process of solving systems of equations using task cards and three different...
Mascil Project
Closed Greenhouses
Controlling the efficiency of a greenhouse is a mathematical task. A collaborative project challenges learners to create an efficiency plan for a closed greenhouse. Using algebraic equations, they consider a set of constraints, design...
EngageNY
Two Graphing Stories
Can you graph your story? Keep your classes interested by challenging them to graph a scenario and interpret the meaning of an intersection. Be sure they paty attention to the detail of a graph, including intercepts, slope,...
EngageNY
Relationships Between Two Numerical Variables
Working in small groups and in pairs, classmates build an understanding of what types of relationships can be used to model individual scatter plots. The nonlinear scatter plots in this lesson on relationships between two numerical...
EngageNY
Modeling a Context from Data (part 1)
While creating models from data, pupils make decisions about precision. Exercises are provided that require linear, quadratic, or exponential models based upon the desired precision.
EngageNY
Analyzing a Graph
Collaborative groups utilize their knowledge of parent functions and transformations to determine the equations associated with graphs. The graph is then related to the scenario it represents.
EngageNY
Mixture Problems
What percent of the mixture is juice? Pairs use their knowledge of proportions to determine what percent a mixture is juice given the percent of juice in the components. Pupils use the procedure learned with the juice mixture problem to...
Illustrative Mathematics
Fruit Salad
Playing with values in this fruit salad problem allows learners to find out how many cherries were mixed in. Your middle schoolers can organize their thoughts in a chart before going into the equation. Eigth graders can skip the chart...
Annenberg Foundation
Skeeters Are Overrunning the World
Skeeters are used to model linear and exponential population growth in a wonderfully organized lesson plan including teachers' and students' notes, an assignment, graphs, tables, and equations. Filled with constant deep-reaching...
EngageNY
Modeling with Quadratic Functions (part 2)
How many points are needed to define a unique parabola? Individuals work with data to answer this question. Ultimately, they determine the quadratic model when given three points. The concept is applied to data from a dropped object,...
Mt. San Antonio Collage
Synthetic Division and Zeros of Polynomial Functions
More than just a learning exercise, this guide provides the description of many of the polynomials theorems to assist the learners. Starting with synthetic division, class members are then guided through the remainder theorem and linear...
Curated OER
What Functions do Two Graph Points Determine?
Your algebra learners write linear, exponential, and quadratic equations containing the same two graph points in this collaborative task.
EngageNY
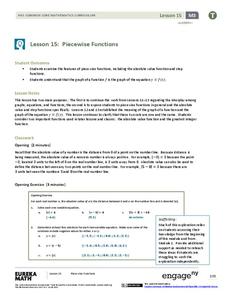
Piecewise Functions
Show your class members that if they can graph a linear function, they can graph an absolute value function. Groups create an absolute value graph using a table, then entertain the idea of an absolute value function defined as two pieces...
EngageNY
Exponential Growth—U.S. Population and World Population
Show how exponential growth can look linear. Pupils come to understand the importance of looking at the entire picture as they compare the US population to the world population. Initially, the populations look linear with the same rate...
Chicago Teachers Union Quest Center
Factored Form of a Quadratic Function
Build upon linear functions to learn about quadratics. The lesson introduces the concept of zeros for quadratic functions and makes the connection to the linear factors of the function. It presents quadratics in both graphical and...
Education Development Center
Creating a Polynomial Function to Fit a Table
Discover relationships between linear and nonlinear functions. Initially, a set of data seems linear, but upon further exploration, pupils realize the data can model an infinite number of functions. Scholars use multiple representations...
NASA
Lights on the International Space Station
Groups explore illumination with NASA's Lighting Environment Test Facility (LETF) as a context. Using the TI-Nspire app, groups determine the lux equation that models their simulation. They then use the lux equation to solve problems...
Curated OER
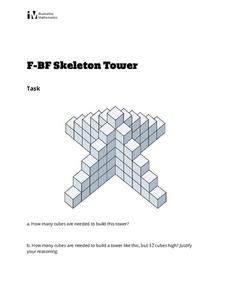
Skeleton Tower
Your algebra learners build a quadratic function in this task of counting the blocks used to build objects. The arithmetic sequence that shows up brings up a shortcut to the long addition using the Gauss Method. Eventually, learners...


