EngageNY
The Graph of a Linear Equation in Two Variables Is a Line
Show your class that linear equations produce graphs of lines. The 20th segment in a unit of 33 provides proof that the graph of a two-variable linear equation is a line. Scholars graph linear equations using two points, either from...
West Contra Costa Unified School District
Sneaking Up on Slope
Pupils determine the pattern in collinear points in order to determine the next point in a sequence. Using the definition of slope, they practice using the slope formula, and finish the activity with three different ways to...
West Contra Costa Unified School District
Point-Slope Application Problems
Create a linear equation for a problem when the intercept information is not given. The two-day lesson introduces the class to the point-slope form, which can be used for problems when the initial conditions are not provided. Pupils...
University of Wisconsin
Measuring Slope for Rain Gardens
The slope of the land is an important feature when considering the erosion that will occur. In this resource, which is part of a rain garden unit, learners calculate the slope of the proposed garden site. Even if you are not planning a...
EngageNY
The Slope of a Non-Vertical Line
This instructional activity introduces the idea of slope and defines it as a numerical measurement of the steepness of a line. Pupils then use the definition to compare lines, find positive and negative slopes, and notice their...
EngageNY
Two Graphing Stories
Can you graph your story? Keep your classes interested by challenging them to graph a scenario and interpret the meaning of an intersection. Be sure they paty attention to the detail of a graph, including intercepts, slope,...
Mathematics Vision Project
Module 7: Connecting Algebra and Geometry
The coordinate plane links key geometry and algebra concepts in this approachable but rigorous unit. The class starts by developing the distance formula from the Pythagorean Theorem, then moves to applications of slope. Activities...
Mathalicious
Domino Effect
Carryout the lesson to determine the cost of pizza toppings from a Domino's Pizza® website while creating a linear model. Learners look through real data—and even create their own pizza—to determine the cost of each topping. They...
EngageNY
Constant Rates Revisited
Find the faster rate. The resource tasks the class to compare proportional relationships represented in different ways. Pupils find the slope of the proportional relationships to determine the constant rates. They then analyze the...
West Contra Costa Unified School District
Derivative – Standard Definition
Making a clear connection to algebra concepts helps learners understand the definition of a derivative. The lesson plan begins with looking at limits of simple linear and rational functions, and leads to the definition of...
Alabama Learning Exchange
Human Slope
Middle and high schoolers explore the concept of slope. In this slope lesson, learners graph lines using a life-size graph. They use chalk on a blacktop to create a coordinate plane and use each other as the tick marks on the grid....
American Statistical Association
What Fits?
The bounce of a golf ball changes the result in golf, mini golf—and a great math activity. Scholars graph the height of golf ball bounces before finding a line of best fit. They analyze their own data and the results of others to better...
Virginia Department of Education
Distance and Midpoint Formulas
Small groups work through two guided activities to derive the distance and midpoint formulas for the coordinate plane. The activities begin with concrete examples and move to abstract.
Virginia Department of Education
Linear Curve of Best Fit
Is foot length to forearm length a linear association? The class collects data of fellow scholars' foot length and the length of their forearms. They plot the data and find a line of best fit. Using that line, they make predictions of...
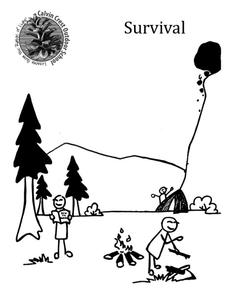
Calvin Crest Outdoor School
Survival
Equip young campers with important survival knowledge with a set of engaging lessons. Teammates work together to complete three outdoor activities, which include building a shelter, starting a campfire, and finding directions in the...
Center Science Education
Model a Moving Glacier
Glaciologists in your class make models of glaciers to simulate how they move down a valley, and then they use it to test any aspect of glacier movement. Not only is this a vivid visual of how these monsters of ice flow, but it is also...
Mathematics Vision Project
Module 6: Congruence, Construction, and Proof
Trace the links between a variety of math concepts in this far-reaching unit. Ideas that seem very different on the outset (like the distance formula and rigid transformations) come together in very natural and logical ways. This...


