Curated OER
What Do Maps Show?
This teaching packet is for grades five through eight, and it is organized around geographic themes: location, place, relationships, movement, and regions. There are four full lessons that are complete with posters, weblinks, and...
Curated OER
John Smith’s Map of the Chesapeake Bay
Young geographers travel back through time with primary source and map analysis and envision Captain John Smith's arrival at the Chesapeake Bay.
Space Awareness
Let's Map the Earth
Before maps went mobile, people actually had to learn how to read maps. Pupils look at map elements in order to understand how to read them and locate specific locations. Finally, young cartographers discover how to make aerial maps.
Academy of American Poets
Teach This Poem: "Maps" by Yesenia Montilla
After examining a physical map of the world, learners conduct a close reading of Yesenia Montilla's poem "Maps." They note the interesting words and phrases, the way the poem is structured, and list questions they might have. After...
DocsTeach
Analyzing a Map of the Louisiana Purchase
With the stroke of a pen, Thomas Jefferson roughly doubled the size of the United States. The Louisiana Purchase not only grew the new country, but also it gave rise to the legends surrounding westward expansion and accelerated the...
NOAA
Mapping the Deep-Ocean Floor
How do you create a map of the ocean floor without getting wet? Middle school oceanographers discover the process of bathymetric mapping in the third installment in a five-part series of lessons designed for seventh and eighth graders....
Curated OER
Mapping the Aegean Seafloor
Earth science learners create a two-dimensional topographic map of the floor of the Aegean Sea. They use it to then create a three-dimensional model of the ocean floor features. This comprehensive resource delivers strong background...
NOAA
Wet Maps
How do oceanographers make maps under water? Junior explorers discover the technologies and processes involved in creating bathymetric maps in part three of a five-part series designed for fifth- and sixth-grade pupils. The lesson...
Polar Trec
Playground Profiling—Topographic Profile Mapping
The Kuril islands stretch from Japan to Russia, and the ongoing dispute about their jurisdiction prevents many scientific research studies. Scholars learn to create a topographic profile of a specific area around their schools. Then they...
NASA
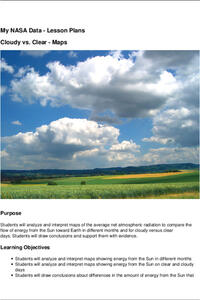
Cloudy vs. Clear - Maps
Find out the science of how clouds keep Earth cooler on hot days. Using guided discussions, investigators analyze and interpret maps of how much solar energy Earth receives at different times of the year. Participants draw conclusions...
National Wildlife Federation
Get Your Techno On
Desert regions are hotter for multiple reasons; the lack of vegetation causes the sun's heat to go straight into the surface and the lack of moisture means none of the heat is being transferred into evaporation. This concept, and other...
Mathematics Assessment Project
Interpreting Distance–Time Graphs
Pre-algebra protégés critique a graph depicting Tom's trip to the bus stop. They work together to match descriptive cards to distance-time graph cards and data table cards, all of which are provided for you so you can make copies for...
Just Health Action
Environmental Justice Matters: Mapping Cumulative Impacts (Part 2)
A case study enables class members to confirm whether different geographic parts of Seattle, Washington have disproportionate environmental burdens and benefits. Groups use the EPA's Cumulative Health Impact Analysis formula and...
Teach Engineering
Where Are the Plastics Near Me? (Mapping the Data)
The last activity in a nine-part series has teams create a Google Earth map using the data they collected during a field trip. Using the map, groups analyze the results and make adjustments to the map to reflect their analysis. A short...
Curated OER
Map It Out
Explore how illustrations add to a story. Young learners will look at picture books to see how the pictures tell the story. They create illustrations to go with a chosen story, and then flip the activity so they have to write a story to...
National WWII Museum
On Leave in Paris: Maps as Primary Sources
Primary sources—even those that seem mundane—offer a window into those who experienced history. Using a Red Cross map offered to soldiers stationed in Paris after World War II alongside worksheet questions, scholars consider what life...
NASA
Erosion and Landslides
A professional-quality PowerPoint, which includes links to footage of actual landslides in action, opens this moving lesson. Viewers learn what conditions lead to erosion and land giving way. They simulate landslides with a variety of...
Columbus City Schools
Thinking Like A Soil Scientist
Ready to roll up those sleeves and get your hands dirty? Dirty with soil science content, that is! Overcome those "But it's just dirt" objections with a trip outside to collect soil samples for some in-class analysis. Use the variety of...
Howard Hughes Medical Institute
Lactase Persistence: Evidence for Selection
What's the link between lactase persistence and dairy farming? Biology scholars analyze data to find evidence of the connection, then relate this to human adaptation. Working individually and in small groups, learners view short video...
DiscoverE
LIDAR: Mapping with Lasers
We would be lost without maps! How are they made? Introduce junior topographers to LIDAR technology with a fascinating activity. Set up a mock city, then have learners operate a laser measure to determine the shape of the landscape using...
Baylor College
Mapping the Spread of HIV/AIDS
Where is HIV/AIDS most prevalent and what are the current trends regarding HIV? Have groups work together to map the world's HIV/AIDS rates, then create a class map with all the data. Lesson includes cross-disciplinary concepts including...
Curated OER
Great Lakes Homepage for Kids
Here are some outstanding lessons on the geology and history of the Great Lakes. These lessons are divided into Grade 4 -6, and Grade 7 - 8 activities. The activities all use the background information, maps, graphs, data, and Great...
NET Foundation for Television
1850-1874 Railroads and Settlement
Have you ever wondered how your town was placed where it is? Scholars research the impact the advancement of the railroad due to the passage of the Kansas-Nebraska Act had on the formation of civilization in the Great Plains. Map...
Curated OER
Representing Data 1: Using Frequency Graphs
Here is a instructional activity that focuses on the use of frequency graphs to identify a range of measures and makes sense of data in a real-world context as well as constructing frequency graphs given information about the mean,...
Other popular searches
- Weather Map Analysis
- Gis Data Map
- Gus Data Map
- Map Data Layer
- Interpreting Map Data
- Interpret Ting Map Data
- Interpretting Map Data
- Gs Data Map


