Education Development Center
Points, Slopes, and Lines
Before graphing and finding distances, learners investigate the coordinate plane and look at patterns related to plotted points. Points are plotted and the goal is to look at the horizontal and vertical distances between coordinates and...
Curated OER
After Reading: "Plot the Plot" Activity in the Library Media Class
"Plot the plot" of "The Adventures of the Speckled Band" with your young readers. Take a few days to read Sir Arthur Conan Doyle's short story as a class or in pairs, having learners write down what they consider to be the most important...
All-in-One High School
Elements of Plot
Cinderella wants to go to the ball and marry the prince. At the end of the story, she does! But how does the plot move from the exposition to the resolution? Teach language arts learners and fairy tale fans about the basics of plot...
Shodor Education Foundation
Scatter Plot
What is the relationship between two variables? Groups work together to gather data on arm spans and height. Using the interactive, learners plot the bivariate data, labeling the axes and the graph. The resource allows scholars to create...
EngageNY
Understanding Box Plots
Scholars apply the concepts of box plots and dot plots to summarize and describe data distributions. They use the data displays to compare sets of data and determine numerical summaries.
Virginia Department of Education
Box-and-Whisker Plots
The teacher demonstrates how to use a graphing calculator to create box-and-whisker plots and identify critical points. Small groups then create their own plots and analyze them and finish by comparing different sets of data using box...
PBS
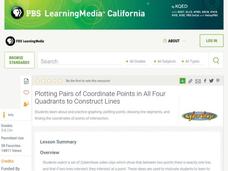
Plotting Pairs of Coordinate Points in All Four Quadrants to Construct Lines
Your young graphers are motivated by watching three Cyberchase videos to plot points in all four quadrants, connect pairs of points to make a line segment, and find the point of intersection of two lines.
EngageNY
Creating a Dot Plot
Which dot am I? Pupils create dot plots to represent sample data through the use of frequency tables. The third segment in a series of 22 asks individuals to analyze the dot plots they created. The scholars translate back and...
Curated OER
Plot of a Short Story (SMART Board)
Help your pupils track the plot of a short story with this SMART Board activity. Using the short story "The Dinner Party" by Mona Gardner (though the lesson would work with any other short story), they define the exposition, rising...
Santa Ana Unified School District
The Power of Point of View
Sometimes a whole story can change based on the perspective of the person telling it. Practice identifying and analyzing point of view in various reading passages and writing assignments with a language arts packet, complete with Common...
EngageNY
The Mean as a Balance Point
It's a balancing act! Pupils balance pennies on a ruler to create a physical representation of a dot plot. The scholars then find the distances of the data points from the balance point, the mean.
EngageNY
Estimating Centers and Interpreting the Mean as a Balance Point
How do you balance a set of data? Using a ruler and some coins, learners determine whether the balance point is always in the middle. Through class and small group discussions, they find that the mean is the the best estimate of the...
Science Matters
Plot Study
Small groups investigate plots of land to discover how abiotic and biotic factors interact. After recording their findings, scholars share observations with peers and self-reflect on the learning process.
PBS
Figurative Language and Foreshadowing in The Outsiders
S.E. Hinton's The Outsiders is still relatable to teenagers today, even though it was written more than 50 years ago. Explore how the figurative language of the story works to establish characterization, and how foreshadowing lays...
EngageNY
Analyzing Point of View and Figurative Language: Noah’s Point of View of Florida
Fishing for words. Scholars search for unfamiliar words in pages 27-29 of Flush, place them in their word catchers, and complete part of Noah’s Point of View graphic organizer. After identifying figurative language, learners analyze...
EngageNY
Displaying a Data Distribution
Pupils analyze a display of data and review dot plots to make general observations about the highest, lowest, common, and the center of the data. To finish, learners match dot plots to scenarios.
Curated OER
Context Clues, Plot Structure, Conflict, and Personal Narrative Essay
What are the elements of a personal narrative? Get your class talking by reading "The Necklace" and "A Dangerous Game." The lesson plan focuses primarily on defining certain vocabulary terms (like context clues, plot, conflict, climax,...
EngageNY
From Ratio Tables, Equations and Double Number Line Diagrams to Plots on the Coordinate Plane
Represent ratios using a variety of methods. Classmates combine the representations of ratios previously learned with the coordinate plane. Using ratio tables, equations, double number lines, and ordered pairs to represent...
Virginia Department of Education
Curve of Best Fit
Which function models the data best? Pupils work through several activities to model data with a variety of functions. Individuals begin by reviewing the shapes of the functions and finding functions that will fit plotted data points. By...
Illustrative Mathematics
Puzzle Times
Give your mathematicians this set of data and have them create a dot plot, then find mean and median. They are asked to question the values of the mean and median and decide why they are not equal. Have learners write their answers or...
Curated OER
Fractured Fairy Tales
Through reading and writing, learners explore common elements found in fairy tales. After discussing traditional fairy tales, class members listen to The True Story of the 3 Little Pigs by John Scieszka, a hilarious retelling of the...
Curated OER
Representing Data 2: Using Box Plots
What information can be gleaned from a box and whiskers plot? Discuss the five summary values - minimum, maximum, upper and lower quartiles, and median - and what conclusions can be made from these values? Included here is a matching...
Education Development Center
Geography of the Coordinate Plane
Put the graph into graphing and allow learners to understand the concept of point plotting and how it relates to data. The worksheet provides a nice way to connect data analysis to a graph and make predictions. The worksheets within...
August House
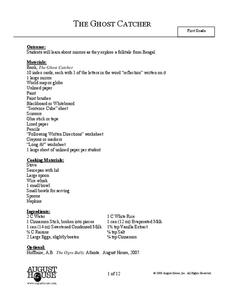
The Ghost Catcher
Delve into a Bengali folktale with a series of reading comprehension activities. Before kids read The Ghost Catcher, they discuss the concept of reflections and mirrors. They then answer comprehension questions about the characters and...
Other popular searches
- Plotting Coordinates Picture
- Plotting Points Pictures
- Fun Plotting Points
- Plotting Points on Graphs
- Plotting Coordinates Maps
- Plotting Coordinates on Maps
- Plotting Points on a Graph
- Plotting Coordinates Graphs
- Plotting Points on a Grid
- Plotting Points Math
- Ell Math Plotting Points


