Curated OER
States Of Matter
Delv into the states of Matter. Students engage in the scientific inquiry process to uncover the exciting world of Matter. They watch a series of videos, and conduct experiments in order to collect and analyze data on the various state...
Curated OER
Coming to America
Through this set of three lessons about Ellis Island, class members will learn about why immigrants came to the United States, find out about the difficulties that went along with coming to America, become familiar with the immigration...
Shmoop
ELA.CCSS.ELA-Literacy.SL.11-12.3
Dr. Martin Luther King Jr.'s speech, "I Have a Dream," is one of the most famous in United States history, but why was it so effective? Ask your class to determine the answer to this question. While the resource includes a description of...
Curated OER
Lead and Mercury: Comparing Two Environmental Evils
High schoolers in chemistry or health courses look at the material safety data sheet (MSDS) and periodic table of elements to gather information about mercury and lead, two toxic materials that have been found in food products. They read...
EngageNY
Congruence, Proof, and Constructions
This amazingly extensive unit covers a wealth of geometric ground, ranging from constructions to angle properties, triangle theorems, rigid transformations, and fundamentals of formal proofs. Each of the almost-forty lessons...
BioEd Online
Good Stress for Your Body
Stress the importance of the different types of pressure our mind and body experience in a lesson about how certain types of stress are actually necessary and good for our bodies. As astronauts and people with injuries can attest, not...
Statistics Education Web
The United States of Obesity
Mississippi has both the highest obesity and poverty rate in the US. Does the rest of the data show a correlation between the poverty and obesity rate in a state? Learners tackle this question as they practice their skills of regression....
Illustrative Mathematics
Oakland Coliseum
Help algebra learners relate a real-life function that happens at the Oakland Coliseum every time the Raiders play. The resource states that the revenue of the Oakland Raiders home games is a function of the number of seats sold and the...
Institute of Electrical and Electronics Engineers
Get Connected with Ohm's Law
Ideal for your electricity unit, especially with middle schoolers, this lesson plan gets engineers using multimeters in electrical circuits to explore the relationships among voltage, current, and resistance. Older learners may even plot...
Texas State Energy Conservation Office
Investigation: Acceleration
Take a look at acceleration within the context of automotive technology. They vary the mass on a toy car and run it down a ramp, exploring Newton's second law of motion. Though this is a classic lab activity, you will appreciate the...
Institute of Electrical and Electronics Engineers
Tinkering with Tops
Get kids' heads spinning by challenging them to design a top that will rotate for a minimum of 10 seconds without leaving a 30-cm circle. Groups of learners collaborate through a planning stage, testing stage, and evaluation stage. Some...
Shodor Education Foundation
Sets and the Venn Diagram (Beginner)
Venn diagrams are helpful in understanding the idea of a set and using attributes to sort items. This basic plan is an introduction with an added bonus of an applet that can be used to demonstrate the activity. If a classroom of...
BioEd Online
Spiders in Space
Does a spider spin its web differently in space? What other ways might microgravity affect an arachnid? Pick a topic to research, plan an investigation, and follow astronauts on the International Space Station as they perform some of the...
Smithsonian Institution
Art to Zoo: Life in the Promised Land: African-American Migrants in Northern Cities, 1916-1940
This is a fantastic resource designed for learners to envision what it was like for the three million African-Americans who migrated to urban industrial centers of the northern United States between 1910 and 1940. After reading a...
Illustrative Mathematics
Telling a Story With Graphs
Turn your algebra learners into meteorologists. Students are given three graphs that contain information about the weather in Santa Rosa, California during the month of February, 2012. Graph one shows temperatures, graph two displays the...
Curated OER
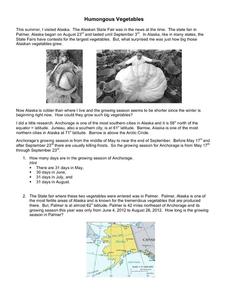
Humongous Vegetables
Humongous vegetables can inspire and awaken your mathematicians to the large math concepts in our Common Core standards. What is the secret to growing such gargantuan garden objects in Alaska? In the state that is closest to the...
US National Archives
WWII: The Pacific 1939-45 – Pearl Harbor
Though December 7th, 1941 was a day "which would live in infamy," World War II had provided many infamous days, events, battles, and atrocities in the years before. So why were American forces so surprised when Japan attacked Pearl...
Curated OER
Nos Creemos Americanos: Braceros in History and Song
Mexican folk songs offer an authentic look at WWII immigrant workers. This study of the U.S. Bracero Program sets historians up with context information so they can write their own corrido. The class reviews themes and formulas of...
Curated OER
Applied Science - Science and Math Lab
Although it was written to use in a science class, this measurement lesson is adaptable to Common Core standards in math for measurement and data. Youngsters are introduced to two types of measurement systems. They use both the...
Curated OER
Classroom Supplies
Challenge young mathematicians to buy classroom supplies by staying within the means of a $1,000 budget. The mathematical activity provides learners with the opportunity to decide what items from the supply list would benefit a class of...
Intel
Forensics: Get a Clue
Although the methods are all scientific, forensic science was started by police officers rather than scientists, who relied on observation and common sense. Young detectives use many tools to solve crimes around the school in a...
Curated OER
The Bell Curve
Learners explore the concept of the bell curve. In this bell curve lesson, students discuss the controversy associated with the bell curve. Learners use an applet to explore a normal distribution. Students discuss mean, median, mode,...
American Statistical Association
Scatter It! (Using Census Results to Help Predict Melissa’s Height)
Pupils use the provided census data to guess the future height of a child. They organize and plot the data, solve for the line of best fit, and determine the likely height and range for a specific age.
American Statistical Association
A Sweet Task
Candy is always an effective motivator! A fun math activity uses M&M's and Skittles to explore two-way frequency tables and conditional probability. The candy can serve a dual purpose as manipulatives and experimental data.

