Curated OER
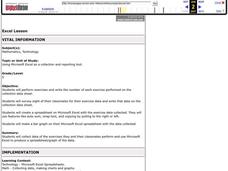
Excel Lesson
Fifth graders will perform exercises and write the number of each exercise performed on the collection data sheet. They survey eight of their classmates for their exercise data and write that data on the collection data sheet. They then...
Curated OER
Excel Lesson
Students investigate Microsoft excel. In this technology lesson plan, students create formulas using excel and apply these formulas to solve relative, absolute and mixed reference cells. They perform immediate and delayed calculations.
Curated OER
Conversation Heart Graphing
Sixth graders review the different types of graphs (bar, line, pictograph) They predict the data set they can garner several boxes of conversation hearts. Students record their data using an Excel spreadsheet. They create a graph based...
Curated OER
Creating Circle Graphs with Microsoft Excel
Students create graphs of circles. In this geometry lesson, students use Microsoft Excel to create graphs. They construct the graphs using paper and pencil as well as the computer.
Curated OER
Data Lesson Vital Information
Students prepare and collect data and use excel and create a graph. They collect data about the number of pattern blocks that are put on tables. Students then record that data in Excel.
Curated OER
How Big Is Your Head?
Students explore measurement by measuring classmates' heads. They record their measurements and they put the measurements in order from smallest to largest. Students figure the mean, median, mode, maximum, minimum, and range of their...
Curated OER
Data Displays with Excel
Students collect and analyze data. In this statistics lesson, students display their data using excel. They plot the data on a coordinate plane and draw conclusion from their data.
Curated OER
Basic Algebra and Computers: Spreadsheets, Charts, and Simple Line Graphs
Students, while in the computer lab, assess how to use Microsoft Excel as a "graphing calculator." They view visual representations of line graphs in a Cartesian plane while incorporating basic skills for using Excel productively.
Curated OER
Using Excel to Reference and Graph Live Data from a Web Site
Students collect live buoy data about water temperatures in the Gulf of Mexico from the Internet and work individually to organize their data and create a line graph using Excel Spreadsheet. Students analyze their data and examine any...
John Hopkins University
Diets and Influence on Food Choice
From start to finish, this is a truly excellent lesson plan addressing the epidemic of diet-related disease in the United States. Learners begin with a reading excerpt of detailed information on trends in the American diet and the...
Teach Engineering
Air Pollution in the Pacific Northwest
Scholars investigate levels of nitrogen dioxide in the Pacific Northwest by examining the role of nitrogen in air pollution and how remote sensing can be used to measure nitrogen levels. An Excel spreadsheet calculates the difference...
LABScI
Population Dynamics: The Predator-Prey Lab
Wolves eat better when the bunny population increases, but how long does that last? A series of 12 biology lessons uses the sixth installment to explore the predator-prey relationship between bunny and wolf populations. Young scientists...
Curated OER
Graph Lesson
First graders collect data on different eye colors of each student in their classroom. They input the data that they gathered in an Excel spreadsheet and then create a graph in Excel.
Curated OER
Class Birthday Graph
Students analyze the basics of an Excel spreadsheet. They highlight cells in a spreadsheet. They make a column graph. Students are introduced to X-axis and Y-axis. They play various address games on the spreadsheet.
The New York Times
Revolt! Comparing Historical Revolutions
What elements are needed to have a revolution? How do historical revolutions from across the globe and generations compare with one another? This is an excellent activity that incorporates group work, source analysis, and an engaging...
Curated OER
Tracking Your Favorite Web Sites
Ninth graders track the hit count on their favorite web sites. In this Algebra I lesson, 9th graders record the number of hits on their favorite web site for twenty days. Students explore the data to determine if the relation defines a...
Curated OER
kind of Bean
Third graders sort different types of beans and collect the data. They create a data table, put the information on the data table and then graph their results. They answer follow-up questions.
Curated OER
Using Spreadsheets and Graphs
Third graders explore mathematics by utilizing computers. In this graphing lesson, 3rd graders gather class data based on a particular topic such as the "favorite candy" of the class. Students utilize this information and computers to...
Curated OER
What Goes Up Must Come Down!!
Fifth graders look at actual sunrise and sunset times for their hometown to determine a pattern in the amount of daylight. They collect their data in Excel and create a chart to help them identify the pattern, then write an explanation...
American Chemical Society
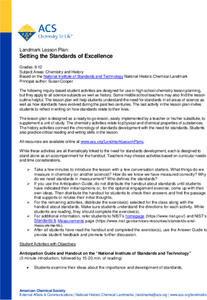
Setting the Standards of Excellence
A number doesn't have much meaning without a standard of reference. Learners read about the history of developing standards to measure chemical and physical properties and complete reading guides to process the information. They focus on...
Curated OER
What's Your Shoe Size? Linear Regression with MS Excel
Learners collect and analyze data. In this statistics lesson, pupils create a liner model of their data and analyze it using central tendencies. They find the linear regression using a spreadsheet.
Curated OER
Fish and Clips
Youngsters test magnetic strength by measuring the mass of paper clips that they "hook" with a magnet. Your first and second graders should love the hands-on activities associated with this plan. The reproducible materials are quite good...
Curated OER
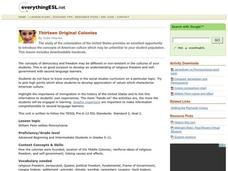
Thirteen Original Colonies
An outstanding lesson on the Thirteen Original Colonies, and the settling of Pennsylvania by William Penn is here for your learners. Valuable discussion takes place regarding how the colonies were settled, and some excellent handouts are...
Curated OER
Sense, Sensibility and Sentences: Examining and Writing Memorable Lines
Involve your readers in finding works of literary genius. Have each individual write down compelling sentences that they read or hear, whether in a newspaper, advertisement, book, movie, song, or any other place! Once each person has a...
Other popular searches
- Microsoft Excel
- Excel Spreadsheets
- Excel Lesson Plans
- Excel Projects
- Microsoft Excel Spreadsheets
- Excel Graphs
- Excel Navigation
- Excel Charts and Graphs
- Computer Basics Excel
- Computer Science Excel
- Computer Literacy Excel
- Ed Excel Math Book


